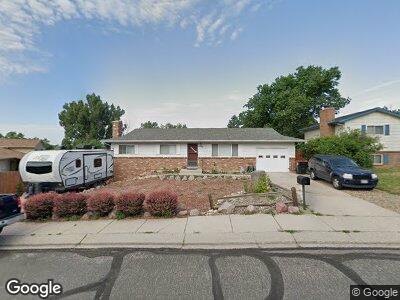
4179 Sod House Trail Colorado Springs, CO 80917
Village Seven NeighborhoodEstimated Value: $346,000 - $389,000
3
Beds
2
Baths
1,071
Sq Ft
$347/Sq Ft
Est. Value
About This Home
This home is located at 4179 Sod House Trail, Colorado Springs, CO 80917 and is currently estimated at $371,239, approximately $346 per square foot. 4179 Sod House Trail is a home located in El Paso County with nearby schools including Rudy Elementary School, Sabin Middle School, and Doherty High School.
Ownership History
Date
Name
Owned For
Owner Type
Purchase Details
Closed on
Dec 14, 2022
Sold by
Pimienta Maria E
Bought by
Burley Maria E and Burley Joel L
Current Estimated Value
Purchase Details
Closed on
Mar 25, 2020
Sold by
Pimenta Maria E
Bought by
Pimienta Maria E and Burley Joel L
Purchase Details
Closed on
Apr 20, 2011
Sold by
Pimineta Maria E and Bell Earl C
Bought by
Pimienta Maria E
Home Financials for this Owner
Home Financials are based on the most recent Mortgage that was taken out on this home.
Original Mortgage
$154,700
Interest Rate
4.85%
Mortgage Type
VA
Purchase Details
Closed on
Jun 13, 2005
Sold by
Tasillo Thomas J and Tasillo Linda B
Bought by
Bell Earl C and Pimienta Maria E
Home Financials for this Owner
Home Financials are based on the most recent Mortgage that was taken out on this home.
Original Mortgage
$165,993
Interest Rate
5.78%
Mortgage Type
VA
Purchase Details
Closed on
Jun 1, 1978
Bought by
Pimienta Maria E
Create a Home Valuation Report for This Property
The Home Valuation Report is an in-depth analysis detailing your home's value as well as a comparison with similar homes in the area
Home Values in the Area
Average Home Value in this Area
Purchase History
| Date | Buyer | Sale Price | Title Company |
|---|---|---|---|
| Burley Maria E | -- | -- | |
| Pimienta Maria E | -- | None Available | |
| Pimienta Maria E | -- | First American | |
| Bell Earl C | $162,500 | Guardian Title Agency | |
| Pimienta Maria E | -- | -- |
Source: Public Records
Mortgage History
| Date | Status | Borrower | Loan Amount |
|---|---|---|---|
| Previous Owner | Pimienta Maria E | $152,501 | |
| Previous Owner | Pimienta Maria E | $154,700 | |
| Previous Owner | Bell Earl C | $165,993 |
Source: Public Records
Tax History Compared to Growth
Tax History
| Year | Tax Paid | Tax Assessment Tax Assessment Total Assessment is a certain percentage of the fair market value that is determined by local assessors to be the total taxable value of land and additions on the property. | Land | Improvement |
|---|---|---|---|---|
| 2024 | $1,180 | $27,680 | $4,400 | $23,280 |
| 2023 | $1,180 | $27,680 | $4,400 | $23,280 |
| 2022 | $1,133 | $20,250 | $3,340 | $16,910 |
| 2021 | $1,229 | $20,820 | $3,430 | $17,390 |
| 2020 | $1,073 | $15,810 | $2,970 | $12,840 |
| 2019 | $1,067 | $15,810 | $2,970 | $12,840 |
| 2018 | $985 | $13,420 | $2,590 | $10,830 |
| 2017 | $933 | $13,420 | $2,590 | $10,830 |
| 2016 | $713 | $12,300 | $2,170 | $10,130 |
| 2015 | $710 | $12,300 | $2,170 | $10,130 |
| 2014 | $667 | $11,080 | $2,170 | $8,910 |
Source: Public Records
Map
Nearby Homes
- 4165 Sod House Trail
- 4879 S Splendid Cir
- 5050 N Splendid Cir
- 4974 Artistic Place
- 5148 Peak Villa Heights
- 5102 Rainbow Harbour Cir
- 4362 Susie View
- 4340 Sammers View
- 4336 Adam Mark Point
- 4768 S Gracemoor Cir
- 4990 Castledown Rd
- 5305 Mountain Peak Point
- 4926 Castledown Rd
- 4759 Picturesque Dr
- 5365 Rawhide Ln
- 5062 Barnes Rd
- 5360 Wagon Master Dr
- 4558 Excalibur Ct
- 4135 Neat Place
- 4568 Castlepoint Dr