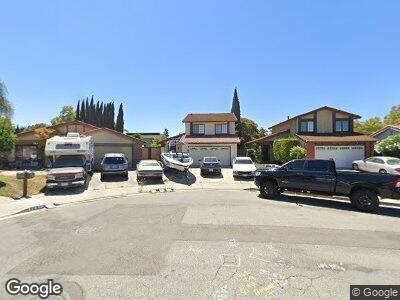
418 Bugatti Ct San Jose, CA 95123
Del Robles NeighborhoodEstimated Value: $1,324,000 - $1,528,000
3
Beds
3
Baths
1,347
Sq Ft
$1,048/Sq Ft
Est. Value
About This Home
This home is located at 418 Bugatti Ct, San Jose, CA 95123 and is currently estimated at $1,412,139, approximately $1,048 per square foot. 418 Bugatti Ct is a home located in Santa Clara County with nearby schools including Del Roble Elementary School, Herman (Leonard) Intermediate School, and Santa Teresa High School.
Ownership History
Date
Name
Owned For
Owner Type
Purchase Details
Closed on
May 24, 2005
Sold by
Lee Stanley Tak and Lee Rita S Chin
Bought by
Jaimes Felix and Jaimes Brenda
Current Estimated Value
Home Financials for this Owner
Home Financials are based on the most recent Mortgage that was taken out on this home.
Original Mortgage
$100,000
Interest Rate
5.74%
Mortgage Type
Credit Line Revolving
Purchase Details
Closed on
Oct 20, 1994
Sold by
Lee Stanley Tak and Lee Rita S Chin
Bought by
Lee Stanley Tak and Lee Rita S Chin
Create a Home Valuation Report for This Property
The Home Valuation Report is an in-depth analysis detailing your home's value as well as a comparison with similar homes in the area
Home Values in the Area
Average Home Value in this Area
Purchase History
| Date | Buyer | Sale Price | Title Company |
|---|---|---|---|
| Jaimes Felix | $649,000 | Ticor Title Company | |
| Lee Stanley Tak | -- | -- |
Source: Public Records
Mortgage History
| Date | Status | Borrower | Loan Amount |
|---|---|---|---|
| Open | Jaimes Felix | $585,500 | |
| Closed | Jaimes Felix | $572,000 | |
| Closed | Jaimes Felix | $37,924 | |
| Closed | Jaimes Felix | $115,000 | |
| Closed | Jaimes Felix | $100,000 | |
| Closed | Jaimes Felix | $549,950 |
Source: Public Records
Tax History Compared to Growth
Tax History
| Year | Tax Paid | Tax Assessment Tax Assessment Total Assessment is a certain percentage of the fair market value that is determined by local assessors to be the total taxable value of land and additions on the property. | Land | Improvement |
|---|---|---|---|---|
| 2023 | $12,384 | $870,780 | $522,376 | $348,404 |
| 2022 | $12,297 | $853,707 | $512,134 | $341,573 |
| 2021 | $12,120 | $836,969 | $502,093 | $334,876 |
| 2020 | $11,862 | $828,388 | $496,945 | $331,443 |
| 2019 | $11,587 | $812,146 | $487,201 | $324,945 |
| 2018 | $11,509 | $796,223 | $477,649 | $318,574 |
| 2017 | $10,709 | $731,000 | $438,500 | $292,500 |
| 2016 | $10,108 | $710,000 | $425,900 | $284,100 |
| 2015 | $8,478 | $588,000 | $352,700 | $235,300 |
| 2014 | $7,406 | $553,000 | $331,700 | $221,300 |
Source: Public Records
Map
Nearby Homes
- 405 Colony Knoll Dr
- 441 Colony Knoll Dr
- 5446 Colony Field Dr
- 410 Colony Cove Dr
- 5459 Entrada Cedros
- 403 Avenida Del Roble
- 569 Blairburry Way
- 531 Churchill Park Dr
- 288 Clearpark Cir
- 317 Greenpark Way
- 259 Sumba Ct
- 432 Violeta Ct
- 622 Lyonburry Place
- 5481 Sean Cir Unit 39
- 4838 Snell Ave
- 5213 Myna Ct
- 310 Tradewinds Dr Unit 2
- 5571 Sunny Oaks Dr
- 4901 New Ramsey Ct
- 288 Tradewinds Dr Unit 13
