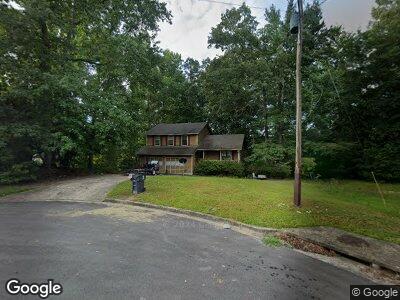
420 Doe Ct Fairburn, GA 30213
Estimated Value: $179,000 - $247,000
3
Beds
2
Baths
1,224
Sq Ft
$170/Sq Ft
Est. Value
About This Home
This home is located at 420 Doe Ct, Fairburn, GA 30213 and is currently estimated at $208,557, approximately $170 per square foot. 420 Doe Ct is a home located in Fulton County with nearby schools including S. L. Lewis Elementary School, Bethune Elementary School, and Mcnair Middle School.
Ownership History
Date
Name
Owned For
Owner Type
Purchase Details
Closed on
May 25, 2011
Sold by
Ard Chester J
Bought by
Snk Properties 2 Llc
Current Estimated Value
Purchase Details
Closed on
Apr 29, 2010
Sold by
Federal Natl Mtg Assn Fnma
Bought by
Ard Chester J
Purchase Details
Closed on
Mar 2, 2010
Sold by
Citimortgage
Bought by
Federal Natl Mtg Assn Fnma
Purchase Details
Closed on
Oct 27, 2004
Sold by
National City Home Loan Svcs Inc
Bought by
Young Odel
Home Financials for this Owner
Home Financials are based on the most recent Mortgage that was taken out on this home.
Original Mortgage
$111,000
Interest Rate
5.62%
Purchase Details
Closed on
Sep 7, 2004
Sold by
Mclendon Kierres P
Bought by
National City Home Loan Svcs Inc
Home Financials for this Owner
Home Financials are based on the most recent Mortgage that was taken out on this home.
Original Mortgage
$111,000
Interest Rate
5.62%
Create a Home Valuation Report for This Property
The Home Valuation Report is an in-depth analysis detailing your home's value as well as a comparison with similar homes in the area
Home Values in the Area
Average Home Value in this Area
Purchase History
| Date | Buyer | Sale Price | Title Company |
|---|---|---|---|
| Snk Properties 2 Llc | $8,000 | -- | |
| Ard Chester J | $26,100 | -- | |
| Federal Natl Mtg Assn Fnma | -- | -- | |
| Citimortgage | $96,118 | -- | |
| Young Odel | $82,000 | -- | |
| National City Home Loan Svcs Inc | $94,007 | -- |
Source: Public Records
Mortgage History
| Date | Status | Borrower | Loan Amount |
|---|---|---|---|
| Closed | Snk Properties 2 Llc | $432,154 | |
| Previous Owner | Young Odel | $111,000 |
Source: Public Records
Tax History Compared to Growth
Tax History
| Year | Tax Paid | Tax Assessment Tax Assessment Total Assessment is a certain percentage of the fair market value that is determined by local assessors to be the total taxable value of land and additions on the property. | Land | Improvement |
|---|---|---|---|---|
| 2023 | $749 | $26,520 | $5,480 | $21,040 |
| 2022 | $1,040 | $26,520 | $5,480 | $21,040 |
| 2021 | $902 | $26,520 | $5,480 | $21,040 |
| 2020 | $970 | $23,840 | $5,200 | $18,640 |
| 2019 | $942 | $23,840 | $5,200 | $18,640 |
| 2018 | $825 | $23,840 | $5,200 | $18,640 |
| 2017 | $844 | $20,720 | $4,720 | $16,000 |
| 2016 | $718 | $20,720 | $4,720 | $16,000 |
| 2015 | $720 | $20,720 | $4,720 | $16,000 |
| 2014 | $426 | $20,720 | $4,720 | $16,000 |
Source: Public Records
Map
Nearby Homes
- 3175 Old Jonesboro Rd
- 755 Autumn Bluffs
- 320 Rebecca Lake Way
- 7434 Rudder Cir
- 6945 Merrywood Dr
- 6945 Brown Dr S
- 7554 Crawford Ct
- 7747 Rudder Cir
- 7569 Bowhead Ct
- 3620 Pickeral St
- 6970 Old Bethsaida Way
- 6895 Brown Dr S
- 7977 Rudder Cir
- 7094 Merrywood Ct
- 7625 Bowhead Ct
- 6695 Buckhurst Trail
- 6685 Buckhurst Trail
- 3641 Oakleaf Pass