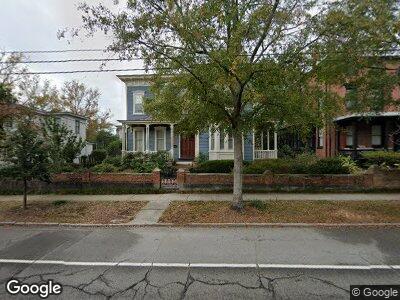
420 S Front St Wilmington, NC 28401
Old Wilmington NeighborhoodEstimated Value: $760,000 - $1,143,000
3
Beds
4
Baths
4,111
Sq Ft
$241/Sq Ft
Est. Value
About This Home
This home is located at 420 S Front St, Wilmington, NC 28401 and is currently estimated at $990,976, approximately $241 per square foot. 420 S Front St is a home located in New Hanover County with nearby schools including Snipes Academy of Arts & Design, Williston Middle School, and New Hanover High School.
Ownership History
Date
Name
Owned For
Owner Type
Purchase Details
Closed on
Oct 18, 2023
Sold by
Murchison John Reid and Murchison Linda Spencer
Bought by
Sidebotham John Nelson and Murchison Frances Dunn
Current Estimated Value
Purchase Details
Closed on
Apr 1, 1984
Sold by
Gurganus Joseph S
Bought by
Murchison John R Ii Linda
Purchase Details
Closed on
Jan 1, 1975
Bought by
Gurganus Joseph S
Create a Home Valuation Report for This Property
The Home Valuation Report is an in-depth analysis detailing your home's value as well as a comparison with similar homes in the area
Home Values in the Area
Average Home Value in this Area
Purchase History
| Date | Buyer | Sale Price | Title Company |
|---|---|---|---|
| Sidebotham John Nelson | $946,500 | None Listed On Document | |
| Murchison John R Ii Linda | $133,500 | -- | |
| Gurganus Joseph S | $18,500 | -- |
Source: Public Records
Tax History Compared to Growth
Tax History
| Year | Tax Paid | Tax Assessment Tax Assessment Total Assessment is a certain percentage of the fair market value that is determined by local assessors to be the total taxable value of land and additions on the property. | Land | Improvement |
|---|---|---|---|---|
| 2023 | $4,786 | $566,400 | $92,400 | $474,000 |
| 2022 | $4,814 | $566,400 | $92,400 | $474,000 |
| 2021 | $6,168 | $566,400 | $92,400 | $474,000 |
| 2020 | $6,168 | $585,500 | $128,500 | $457,000 |
| 2019 | $6,168 | $585,500 | $128,500 | $457,000 |
| 2018 | $0 | $585,500 | $128,500 | $457,000 |
| 2017 | $6,168 | $585,500 | $128,500 | $457,000 |
| 2016 | $4,778 | $431,200 | $154,800 | $276,400 |
| 2015 | $4,566 | $431,200 | $154,800 | $276,400 |
| 2014 | $4,372 | $431,200 | $154,800 | $276,400 |
Source: Public Records
Map
Nearby Homes
- 416 S Front St Unit 1
- 501 S Front St
- 508 S Front St
- 504 S 2nd St
- 226 S Front St
- 501 S 3rd St
- 622 S 2nd St Unit 6
- 511 S 3rd St
- 610 S 3rd St
- 215 S Water St Unit 204
- 215 S Water St Unit 102
- 215 S Water St Unit 103
- 313 Church St
- 209 Queen St
- 315 S 3rd St
- 211 S 2nd St
- 311 S 3rd St
- 215 Queen St
- 700 S 3rd St
- 409 S 4th St