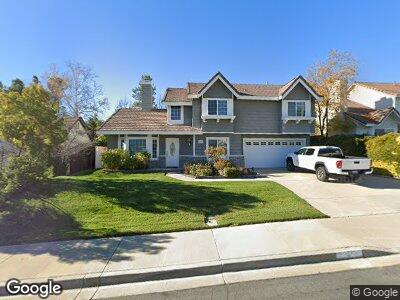
42079 Rubicon Cir Temecula, CA 92591
Alta Vista NeighborhoodEstimated Value: $774,000 - $891,000
4
Beds
3
Baths
2,385
Sq Ft
$340/Sq Ft
Est. Value
About This Home
This home is located at 42079 Rubicon Cir, Temecula, CA 92591 and is currently estimated at $811,524, approximately $340 per square foot. 42079 Rubicon Cir is a home located in Riverside County with nearby schools including Rancho Elementary School, Margarita Middle School, and Temecula Valley High School.
Ownership History
Date
Name
Owned For
Owner Type
Purchase Details
Closed on
Jan 20, 2011
Sold by
Mielke Donald and Mielke Penny
Bought by
Thomas Mark and Thomas Eileen
Current Estimated Value
Purchase Details
Closed on
Feb 16, 2001
Sold by
Herried Steven S and Herried Donna Mae
Bought by
Mielke Donald and Mielke Penny
Home Financials for this Owner
Home Financials are based on the most recent Mortgage that was taken out on this home.
Original Mortgage
$188,000
Interest Rate
7.11%
Purchase Details
Closed on
Sep 30, 1999
Sold by
Herried Steven S and Herried Donna Mae
Bought by
Herried Steven S and Herried Donna Mae
Purchase Details
Closed on
Feb 17, 1999
Sold by
Herried Steven S and Herried Melissa A
Bought by
Herried Steven S and Beeson Donna Mae
Home Financials for this Owner
Home Financials are based on the most recent Mortgage that was taken out on this home.
Original Mortgage
$136,000
Interest Rate
6.73%
Create a Home Valuation Report for This Property
The Home Valuation Report is an in-depth analysis detailing your home's value as well as a comparison with similar homes in the area
Home Values in the Area
Average Home Value in this Area
Purchase History
| Date | Buyer | Sale Price | Title Company |
|---|---|---|---|
| Thomas Mark | $325,000 | Western Resources Title | |
| Mielke Donald | $198,000 | First American Title Co | |
| Herried Steven S | -- | -- | |
| Herried Steven S | -- | Chicago Title Co |
Source: Public Records
Mortgage History
| Date | Status | Borrower | Loan Amount |
|---|---|---|---|
| Open | Thomas Mark | $185,000 | |
| Previous Owner | Mielke Donald | $70,000 | |
| Previous Owner | Mielke Donald | $298,400 | |
| Previous Owner | Mielke Donald | $60,000 | |
| Previous Owner | Mielke Donald | $188,000 | |
| Previous Owner | Herried Steven S | $136,000 |
Source: Public Records
Tax History Compared to Growth
Tax History
| Year | Tax Paid | Tax Assessment Tax Assessment Total Assessment is a certain percentage of the fair market value that is determined by local assessors to be the total taxable value of land and additions on the property. | Land | Improvement |
|---|---|---|---|---|
| 2023 | $4,875 | $400,199 | $61,562 | $338,637 |
| 2022 | $4,723 | $392,353 | $60,355 | $331,998 |
| 2021 | $4,622 | $384,661 | $59,172 | $325,489 |
| 2020 | $4,571 | $380,718 | $58,566 | $322,152 |
| 2019 | $4,503 | $373,254 | $57,418 | $315,836 |
| 2018 | $4,413 | $365,937 | $56,294 | $309,643 |
| 2017 | $4,333 | $358,763 | $55,191 | $303,572 |
| 2016 | $4,249 | $351,729 | $54,109 | $297,620 |
| 2015 | $4,173 | $346,448 | $53,298 | $293,150 |
| 2014 | $4,045 | $339,663 | $52,255 | $287,408 |
Source: Public Records
Map
Nearby Homes
- 42068 Humber Dr
- 30416 Danube Ct
- 30270 Churchill Ct
- 30436 Danube Ct
- 42135 Chestnut Dr
- 42038 Acacia Way
- 42092 Orange Blossom Dr
- 30512 Milky Way Dr
- 41910 Humber Dr
- 41940 Kaffirboom Ct
- 30387 San Pasqual Rd
- 30451 San Pasqual Rd
- 30861 Mead River Ct
- 30585 San Pasqual Rd
- 30305 Del Rey Rd
- 30275 Del Rey Rd
- 42520 Verdadero Place
- 30754 Links Ct
- 30200 Santa Cecilia Dr
- 42220 Agena St