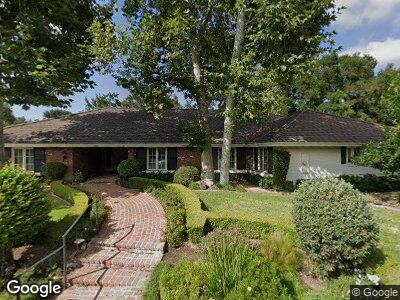
4223 Palomino Cir Westlake Village, CA 91362
Estimated Value: $2,184,000 - $2,842,000
5
Beds
4
Baths
3,294
Sq Ft
$759/Sq Ft
Est. Value
About This Home
This home is located at 4223 Palomino Cir, Westlake Village, CA 91362 and is currently estimated at $2,501,327, approximately $759 per square foot. 4223 Palomino Cir is a home located in Ventura County with nearby schools including Westlake Hills Elementary School, Colina Middle School, and Westlake High School.
Create a Home Valuation Report for This Property
The Home Valuation Report is an in-depth analysis detailing your home's value as well as a comparison with similar homes in the area
Home Values in the Area
Average Home Value in this Area
Tax History Compared to Growth
Tax History
| Year | Tax Paid | Tax Assessment Tax Assessment Total Assessment is a certain percentage of the fair market value that is determined by local assessors to be the total taxable value of land and additions on the property. | Land | Improvement |
|---|---|---|---|---|
| 2024 | $13,720 | $1,240,752 | $764,851 | $475,901 |
| 2023 | $13,343 | $1,216,424 | $749,854 | $466,570 |
| 2022 | $13,104 | $1,192,573 | $735,151 | $457,422 |
| 2021 | $12,875 | $1,169,190 | $720,737 | $448,453 |
| 2020 | $12,351 | $1,157,203 | $713,348 | $443,855 |
| 2019 | $12,023 | $1,134,513 | $699,361 | $435,152 |
| 2018 | $11,780 | $1,112,269 | $685,649 | $426,620 |
| 2017 | $11,549 | $1,090,460 | $672,205 | $418,255 |
| 2016 | $11,433 | $1,069,079 | $659,025 | $410,054 |
| 2015 | $11,235 | $1,053,023 | $649,127 | $403,896 |
| 2014 | $11,072 | $1,032,397 | $636,412 | $395,985 |
Source: Public Records
Map
Nearby Homes
- 4264 Palomino Cir
- 1481 Kingston Cir
- 1591 Upper Ranch Rd
- 4419 Valley Spring Dr
- 1635 Ryder Cup Dr
- 1659 Ryder Cup Dr
- 4609 Sunnyhill St
- 4301 Golf Course Dr
- 1709 Royal Saint George Dr
- 1527 N View Dr
- 4032 Cresthaven Dr
- 1677 Plum Hollow Cir
- 1487 N View Dr
- 4671 Club View Dr
- 4334 Oak Place Dr
- 1090 Vista Ridge Ln
- 4226 Dan Wood Dr
- 1773 Blue Hill Ct
- 4546 Rayburn St
- 4799 Canterbury St