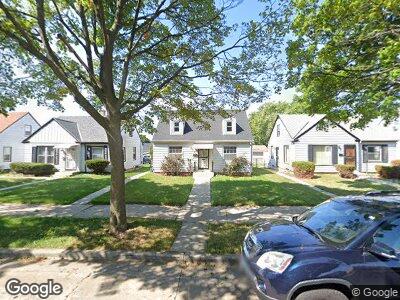
4249 N 28th St Milwaukee, WI 53216
Garden Homes NeighborhoodEstimated Value: $110,394 - $135,000
2
Beds
1
Bath
1,092
Sq Ft
$110/Sq Ft
Est. Value
About This Home
This home is located at 4249 N 28th St, Milwaukee, WI 53216 and is currently estimated at $120,349, approximately $110 per square foot. 4249 N 28th St is a home located in Milwaukee County with nearby schools including Franklin Elementary School, Craig Montessori School, and Milwaukee German Immersion School.
Ownership History
Date
Name
Owned For
Owner Type
Purchase Details
Closed on
Aug 8, 2014
Sold by
Awosika Richard O
Bought by
Rolac Investment Llc
Current Estimated Value
Purchase Details
Closed on
Jul 30, 2014
Sold by
Buckner Sonya D
Bought by
Awosika Richard O
Purchase Details
Closed on
May 20, 2002
Sold by
Charles Rubnitz Co Inc
Bought by
Buckner Sonya D
Home Financials for this Owner
Home Financials are based on the most recent Mortgage that was taken out on this home.
Original Mortgage
$49,988
Interest Rate
6.87%
Mortgage Type
FHA
Purchase Details
Closed on
Dec 14, 2001
Sold by
Binninger Marlene T
Bought by
Charles Rubnitz Co Inc
Purchase Details
Closed on
Sep 14, 2001
Sold by
Bauer Margaret
Bought by
Binninger Marlene T
Purchase Details
Closed on
Apr 12, 2001
Sold by
Muehlbach Robert F and Bauer Margaret
Bought by
Bauer Margaret
Create a Home Valuation Report for This Property
The Home Valuation Report is an in-depth analysis detailing your home's value as well as a comparison with similar homes in the area
Home Values in the Area
Average Home Value in this Area
Purchase History
| Date | Buyer | Sale Price | Title Company |
|---|---|---|---|
| Rolac Investment Llc | -- | Merit Title | |
| Awosika Richard O | $18,000 | None Available | |
| Buckner Sonya D | $49,900 | -- | |
| Charles Rubnitz Co Inc | $13,000 | -- | |
| Binninger Marlene T | -- | -- |
Source: Public Records
Mortgage History
| Date | Status | Borrower | Loan Amount |
|---|---|---|---|
| Previous Owner | Buckner Sonya D | $72,474 | |
| Previous Owner | Buckner Sonya D | $61,300 | |
| Previous Owner | Buckner Sonya D | $49,988 |
Source: Public Records
Tax History Compared to Growth
Tax History
| Year | Tax Paid | Tax Assessment Tax Assessment Total Assessment is a certain percentage of the fair market value that is determined by local assessors to be the total taxable value of land and additions on the property. | Land | Improvement |
|---|---|---|---|---|
| 2023 | $1,690 | $71,500 | $3,700 | $67,800 |
| 2022 | $1,629 | $71,500 | $3,700 | $67,800 |
| 2021 | $1,444 | $57,600 | $3,700 | $53,900 |
| 2020 | $1,631 | $57,600 | $3,700 | $53,900 |
| 2019 | $1,061 | $46,500 | $3,700 | $42,800 |
| 2018 | $1,136 | $46,500 | $3,700 | $42,800 |
| 2017 | $1,141 | $44,500 | $4,500 | $40,000 |
| 2016 | $2,496 | $47,500 | $4,500 | $43,000 |
| 2015 | $1,272 | $46,100 | $4,500 | $41,600 |
| 2014 | $1,654 | $46,100 | $4,500 | $41,600 |
| 2013 | -- | $51,200 | $4,500 | $46,700 |
Source: Public Records
Map
Nearby Homes
- 4239 N 29th St
- 4271 N 26th St
- 4119 N 25th St
- 4348 N 30th St
- 4036 N 25th St Unit 4038
- 4366 N 25th St
- 3015 W Capitol Dr
- 4415 N Teutonia Ave
- 3941 N 25th St
- 4465 N 27th St Unit 4467
- 3946 N 25th St
- 4503 N 28th St
- 3941 N 30th St
- 2237 W Olive St
- 3871 N 25th St
- 4532 N 26th St
- 3907 N 24th St
- 3843 N 25th St
- 3918 N 24th St Unit 3920
- 4556 N 30th St