
Seller's Agent in 2023
Brian Marcello
New World Realty
(508) 409-7777
16 Total Sales
Estimated Value: $270,950 - $311,000
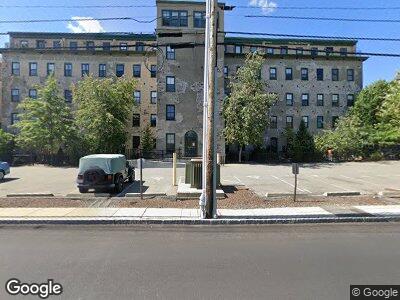
Welcome to the Residences on Falls Pond in North Attleboro. Bring your fishing pole and kayak! This updated unit is located on the corner of the building, being one of the few units with its own private entrance and patio area. Enjoy open concept living and 10' ceilings, making it feel extra spacious. The kitchen is updated throughout, including all stainless steel appliances, and granite countertops and island with additional storage. The living room features an electric fireplace, and private entrance leading to your own outside patio space. There are two bedrooms with wall to wall carpeting and closet space for storage. Convenient in unit washer/dryer. The unit includes access to a mail room, designated fitness area, and just steps to Upper Falls Pond with boating, fishing, swimming, and gorgeous sunsets. First, last, and security required. Credit history and income verification is required. All tenants over the age of 18 to fill out application. $25 non-refundable processing fee
| Date | Buyer | Sale Price | Title Company |
|---|---|---|---|
| Smith Brett M | $215,000 | -- |
| Date | Status | Borrower | Loan Amount |
|---|---|---|---|
| Open | Donnelly Patricia | $75,000 | |
| Open | Smith Brett M | $141,000 | |
| Closed | Smith Brett M | $172,000 | |
| Closed | Smith Brett M | $32,250 |
| Date | Event | Price | Change | Sq Ft Price |
|---|---|---|---|---|
| 10/06/2023 10/06/23 | Rented | $2,200 | 0.0% | -- |
| 09/08/2023 09/08/23 | Under Contract | -- | -- | -- |
| 09/08/2023 09/08/23 | Price Changed | $2,200 | -4.3% | $3 / Sq Ft |
| 08/15/2023 08/15/23 | Price Changed | $2,300 | -8.0% | $3 / Sq Ft |
| 08/05/2023 08/05/23 | For Rent | $2,500 | 0.0% | -- |
| 05/01/2023 05/01/23 | Sold | $262,000 | +9.6% | $334 / Sq Ft |
| 04/10/2023 04/10/23 | Pending | -- | -- | -- |
| 04/09/2023 04/09/23 | For Sale | $239,000 | 0.0% | $305 / Sq Ft |
| 04/09/2023 04/09/23 | Off Market | $239,000 | -- | -- |
| 04/05/2023 04/05/23 | For Sale | $239,000 | +40.6% | $305 / Sq Ft |
| 05/12/2017 05/12/17 | Sold | $170,000 | +3.0% | $217 / Sq Ft |
| 04/03/2017 04/03/17 | Pending | -- | -- | -- |
| 03/30/2017 03/30/17 | For Sale | $165,000 | -2.9% | $210 / Sq Ft |
| 03/14/2017 03/14/17 | Off Market | $170,000 | -- | -- |
| 03/01/2017 03/01/17 | For Sale | $165,000 | -- | $210 / Sq Ft |
| Year | Tax Paid | Tax Assessment Tax Assessment Total Assessment is a certain percentage of the fair market value that is determined by local assessors to be the total taxable value of land and additions on the property. | Land | Improvement |
|---|---|---|---|---|
| 2025 | $2,925 | $248,100 | $0 | $248,100 |
| 2024 | $2,553 | $221,200 | $0 | $221,200 |
| 2023 | $2,509 | $196,200 | $0 | $196,200 |
| 2022 | $2,491 | $178,800 | $0 | $178,800 |
| 2021 | $2,218 | $155,400 | $0 | $155,400 |
| 2020 | $2,277 | $158,700 | $0 | $158,700 |
| 2019 | $2,268 | $159,300 | $0 | $159,300 |
| 2018 | $2,085 | $156,300 | $0 | $156,300 |
| 2017 | $1,565 | $118,400 | $0 | $118,400 |
| 2016 | $1,248 | $94,400 | $0 | $94,400 |
| 2015 | $1,240 | $94,400 | $0 | $94,400 |
| 2014 | $1,654 | $124,900 | $0 | $124,900 |
Seller's Agent in 2023
Brian Marcello
New World Realty
(508) 409-7777
16 Total Sales
Seller's Agent in 2023
Kelly White
Redfin Corp.
(508) 962-4069
Buyer's Agent in 2023
Koury Signoriello Realtor Group
New World Realty
(774) 991-2579
144 Total Sales
Buyer's Agent in 2023
Nest / Syndi Zaiger Group
Compass
(617) 206-3333
115 Total Sales
Seller's Agent in 2017
Anthony Ruggiero
Keller Williams Elite
(781) 775-8200
78 Total Sales