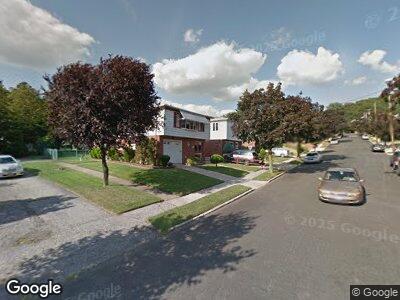
43 Sunnyside Terrace Staten Island, NY 10301
Sunnyside NeighborhoodEstimated Value: $797,000 - $951,550
4
Beds
2
Baths
2,200
Sq Ft
$410/Sq Ft
Est. Value
About This Home
This home is located at 43 Sunnyside Terrace, Staten Island, NY 10301 and is currently estimated at $902,388, approximately $410 per square foot. 43 Sunnyside Terrace is a home located in Richmond County with nearby schools including P.S. 35 The Clove Valley School, Intermediate School 27, and Curtis High School.
Create a Home Valuation Report for This Property
The Home Valuation Report is an in-depth analysis detailing your home's value as well as a comparison with similar homes in the area
Home Values in the Area
Average Home Value in this Area
Tax History Compared to Growth
Tax History
| Year | Tax Paid | Tax Assessment Tax Assessment Total Assessment is a certain percentage of the fair market value that is determined by local assessors to be the total taxable value of land and additions on the property. | Land | Improvement |
|---|---|---|---|---|
| 2024 | $7,306 | $49,020 | $8,932 | $40,088 |
| 2023 | $3,198 | $39,445 | $8,100 | $31,345 |
| 2022 | $2,866 | $51,540 | $11,040 | $40,500 |
| 2021 | $2,983 | $44,880 | $11,040 | $33,840 |
| 2020 | $6,720 | $49,620 | $11,040 | $38,580 |
| 2019 | $6,620 | $44,100 | $11,040 | $33,060 |
| 2018 | $6,403 | $32,871 | $8,603 | $24,268 |
| 2017 | $6,022 | $31,011 | $9,071 | $21,940 |
| 2016 | $5,539 | $29,256 | $9,823 | $19,433 |
| 2015 | $4,980 | $27,600 | $9,180 | $18,420 |
| 2014 | $4,980 | $27,540 | $9,180 | $18,360 |
Source: Public Records
Map
Nearby Homes
- 36 Sunnyside Terrace
- 118 van Cortlandt Ave
- 0 Clove Rd
- 1386 Clove Rd
- 1384 Clove Rd
- 1380 Clove Rd
- 150 Dudley Ave
- 1368 -1372 Clove Rd
- 8 Alpine Ave
- 1368 Clove Rd
- 850 Howard Ave Unit 3J
- 850 Howard Ave Unit 1J
- 1890 Clove Rd
- 21 Cayuga Ave
- 14 Ridge Ct
- 12 Ridge Ct
- 139 Highland Ave
- 83 Glenwood Ave
- 106 Highland Ave