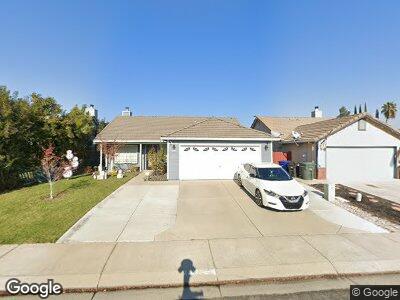
4305 Castle Cary Ln Salida, CA 95368
Estimated Value: $399,000 - $461,000
2
Beds
2
Baths
1,156
Sq Ft
$370/Sq Ft
Est. Value
About This Home
This home is located at 4305 Castle Cary Ln, Salida, CA 95368 and is currently estimated at $427,721, approximately $370 per square foot. 4305 Castle Cary Ln is a home located in Stanislaus County with nearby schools including Dena Boer Elementary School, Salida Middle School - Vella Campus, and Joseph A. Gregori High School.
Ownership History
Date
Name
Owned For
Owner Type
Purchase Details
Closed on
Apr 27, 2009
Sold by
Richards Carmen S and Richard Marital Trust
Bought by
Aguilera Emmanuel G and Cuevas Angelica M
Current Estimated Value
Home Financials for this Owner
Home Financials are based on the most recent Mortgage that was taken out on this home.
Original Mortgage
$137,857
Interest Rate
4.71%
Mortgage Type
FHA
Purchase Details
Closed on
Aug 7, 2000
Sold by
Richards Carmen S and Richards Family Trust
Bought by
Richards Carmen S and Richards Marital Trust
Purchase Details
Closed on
Mar 24, 1995
Sold by
Somerset Estates Inc
Bought by
Richards Everett W and Richards Carmen S
Home Financials for this Owner
Home Financials are based on the most recent Mortgage that was taken out on this home.
Original Mortgage
$70,000
Interest Rate
8.77%
Create a Home Valuation Report for This Property
The Home Valuation Report is an in-depth analysis detailing your home's value as well as a comparison with similar homes in the area
Home Values in the Area
Average Home Value in this Area
Purchase History
| Date | Buyer | Sale Price | Title Company |
|---|---|---|---|
| Aguilera Emmanuel G | $140,500 | Chicago Title Company | |
| Richards Carmen S | -- | -- | |
| Richards Everett W | $110,000 | First American Title Company |
Source: Public Records
Mortgage History
| Date | Status | Borrower | Loan Amount |
|---|---|---|---|
| Open | Aguilera Emmanuel G | $110,755 | |
| Closed | Aguilera Emmanuel G | $137,857 | |
| Previous Owner | Richards Everett W | $70,000 |
Source: Public Records
Tax History Compared to Growth
Tax History
| Year | Tax Paid | Tax Assessment Tax Assessment Total Assessment is a certain percentage of the fair market value that is determined by local assessors to be the total taxable value of land and additions on the property. | Land | Improvement |
|---|---|---|---|---|
| 2024 | $3,373 | $177,245 | $50,494 | $126,751 |
| 2023 | $3,313 | $173,770 | $49,504 | $124,266 |
| 2022 | $3,202 | $170,364 | $48,534 | $121,830 |
| 2021 | $3,153 | $167,025 | $47,583 | $119,442 |
| 2020 | $3,029 | $165,314 | $47,096 | $118,218 |
| 2019 | $2,988 | $162,073 | $46,173 | $115,900 |
| 2018 | $2,982 | $158,896 | $45,268 | $113,628 |
| 2017 | $2,923 | $155,781 | $44,381 | $111,400 |
| 2016 | $2,869 | $152,727 | $43,511 | $109,216 |
| 2015 | $2,835 | $150,434 | $42,858 | $107,576 |
| 2014 | $2,805 | $147,488 | $42,019 | $105,469 |
Source: Public Records
Map
Nearby Homes
- 4608 Sweet William Ct
- 4221 Bahlke Ct
- 0 Finney Rd
- 5101 Danforth Cir
- 5100 Newbold Ln
- 4029 Gagos Dr
- 4913 Sequoia St
- 4104 Hennings Dr
- 5204 Corfu Cir
- 5216 San Tropez Dr
- 3424 Vintage Dr Unit 147
- 5320 Newquay Ln
- 3400 Sullivan Ct Unit 103
- 3400 Sullivan Ct Unit 118
- 3400 Sullivan Ct Unit 206
- 3400 Sullivan Ct Unit 122
- 3400 Sullivan Ct Unit 169
- 5048 Driftwood Dr
- 4617 Wessex Ln
- 3305 Fleur de Lis Dr