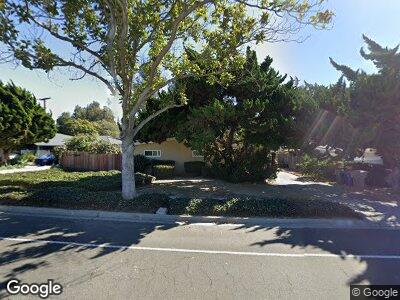
4362 Dean Dr Ventura, CA 93003
College NeighborhoodEstimated Value: $940,420 - $1,044,000
3
Beds
2
Baths
1,577
Sq Ft
$614/Sq Ft
Est. Value
About This Home
This home is located at 4362 Dean Dr, Ventura, CA 93003 and is currently estimated at $967,605, approximately $613 per square foot. 4362 Dean Dr is a home located in Ventura County with nearby schools including Elmhurst Elementary School, Anacapa Middle School, and Buena High School.
Ownership History
Date
Name
Owned For
Owner Type
Purchase Details
Closed on
Mar 30, 2016
Sold by
Tormey John and Tormey Jennifer I
Bought by
The Tormey Family Trust and Tormey Jennifer
Current Estimated Value
Purchase Details
Closed on
Jul 8, 2009
Sold by
Tormey John and Tormey Jennifer I
Bought by
Tormey John and Tormey Jennifer I
Home Financials for this Owner
Home Financials are based on the most recent Mortgage that was taken out on this home.
Original Mortgage
$191,000
Outstanding Balance
$130,874
Interest Rate
5.59%
Mortgage Type
Stand Alone Refi Refinance Of Original Loan
Estimated Equity
$834,122
Purchase Details
Closed on
Feb 2, 1999
Sold by
The Estate Of Irene A Maertens and Beisel Martin G
Bought by
Tormey John P and Tormey Jennifer
Home Financials for this Owner
Home Financials are based on the most recent Mortgage that was taken out on this home.
Original Mortgage
$94,000
Interest Rate
6.73%
Create a Home Valuation Report for This Property
The Home Valuation Report is an in-depth analysis detailing your home's value as well as a comparison with similar homes in the area
Home Values in the Area
Average Home Value in this Area
Purchase History
| Date | Buyer | Sale Price | Title Company |
|---|---|---|---|
| The Tormey Family Trust | -- | None Available | |
| Tormey John | -- | First American Title Company | |
| Tormey John P | $230,000 | Fidelity National Title Co |
Source: Public Records
Mortgage History
| Date | Status | Borrower | Loan Amount |
|---|---|---|---|
| Open | Tormey John | $191,000 | |
| Closed | Tormey John P | $50,000 | |
| Closed | Tormey John P | $135,250 | |
| Closed | Tormey John P | $30,000 | |
| Closed | Tormey John P | $94,000 | |
| Closed | Tormey John P | $91,000 |
Source: Public Records
Tax History Compared to Growth
Tax History
| Year | Tax Paid | Tax Assessment Tax Assessment Total Assessment is a certain percentage of the fair market value that is determined by local assessors to be the total taxable value of land and additions on the property. | Land | Improvement |
|---|---|---|---|---|
| 2024 | $3,891 | $353,470 | $212,089 | $141,381 |
| 2023 | $3,847 | $346,540 | $207,931 | $138,609 |
| 2022 | $3,580 | $339,746 | $203,854 | $135,892 |
| 2021 | $3,518 | $333,085 | $199,857 | $133,228 |
| 2020 | $3,486 | $329,671 | $197,808 | $131,863 |
| 2019 | $3,423 | $323,208 | $193,930 | $129,278 |
| 2018 | $3,365 | $316,872 | $190,128 | $126,744 |
| 2017 | $3,304 | $310,659 | $186,400 | $124,259 |
| 2016 | $3,246 | $304,569 | $182,746 | $121,823 |
| 2015 | $3,194 | $299,996 | $180,002 | $119,994 |
| 2014 | $3,149 | $294,122 | $176,477 | $117,645 |
Source: Public Records
Map
Nearby Homes
- 4432 Westmont St
- 4700 Aurora Dr Unit 106
- 4015 Bermuda Ct
- 3980 Telegraph Rd
- 4499 Copland Dr Unit 34
- 578 Donizetti Ave
- 3700 Dean Dr Unit 3306
- 3700 Dean Dr Unit 1202
- 3700 Dean Dr Unit 1303
- 3700 Dean Dr Unit 3008
- 3700 Dean Dr Unit 2703
- 4212 Gettysburg St
- 4886 Sullivan St
- 3750 Mound Ave
- 1019 Thomas Ln
- 4986 Sullivan St
- 4797 Loma Vista Rd
- 231 Court Ave
- 209 Dorothy Ave
- 311 Rodgers St Unit 311