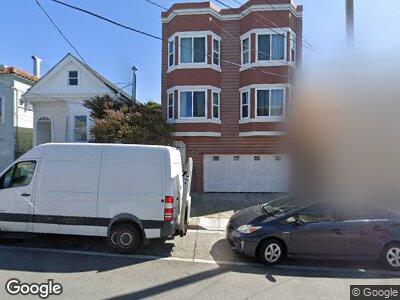
437 Holloway Ave San Francisco, CA 94112
Ingleside NeighborhoodEstimated Value: $1,031,000 - $1,647,121
5
Beds
4
Baths
2,650
Sq Ft
$519/Sq Ft
Est. Value
About This Home
This home is located at 437 Holloway Ave, San Francisco, CA 94112 and is currently estimated at $1,374,030, approximately $518 per square foot. 437 Holloway Ave is a home located in San Francisco County with nearby schools including Sunnyside Elementary School, Denman (James) Middle School, and Leadership High School.
Ownership History
Date
Name
Owned For
Owner Type
Purchase Details
Closed on
Jun 22, 2006
Sold by
Campos Doris M and Salgado Rosa
Bought by
Campos Doris M
Current Estimated Value
Home Financials for this Owner
Home Financials are based on the most recent Mortgage that was taken out on this home.
Original Mortgage
$723,750
Outstanding Balance
$451,812
Interest Rate
7.12%
Mortgage Type
Commercial
Estimated Equity
$918,951
Purchase Details
Closed on
Sep 19, 1996
Sold by
Vargas Doris M
Bought by
Vargas Doris M and Salgado Rosa
Purchase Details
Closed on
Oct 28, 1994
Sold by
Salgado Rosa and Vargas Doris M
Bought by
Vargas Doris M
Home Financials for this Owner
Home Financials are based on the most recent Mortgage that was taken out on this home.
Original Mortgage
$324,000
Interest Rate
8.78%
Mortgage Type
Commercial
Create a Home Valuation Report for This Property
The Home Valuation Report is an in-depth analysis detailing your home's value as well as a comparison with similar homes in the area
Home Values in the Area
Average Home Value in this Area
Purchase History
| Date | Buyer | Sale Price | Title Company |
|---|---|---|---|
| Campos Doris M | -- | Fidelity National Title Co | |
| Vargas Doris M | -- | -- | |
| Vargas Doris M | -- | Chicago Title Company | |
| Vargas Doris M | -- | Chicago Title Company |
Source: Public Records
Mortgage History
| Date | Status | Borrower | Loan Amount |
|---|---|---|---|
| Open | Campos Doris M | $723,750 | |
| Closed | Vargas Doris M | $324,000 |
Source: Public Records
Tax History Compared to Growth
Tax History
| Year | Tax Paid | Tax Assessment Tax Assessment Total Assessment is a certain percentage of the fair market value that is determined by local assessors to be the total taxable value of land and additions on the property. | Land | Improvement |
|---|---|---|---|---|
| 2024 | $10,003 | $793,572 | $396,786 | $396,786 |
| 2023 | $9,846 | $778,012 | $389,006 | $389,006 |
| 2022 | $9,649 | $762,760 | $381,380 | $381,380 |
| 2021 | $9,474 | $747,804 | $373,902 | $373,902 |
| 2020 | $9,610 | $740,140 | $370,070 | $370,070 |
| 2019 | $9,284 | $725,628 | $362,814 | $362,814 |
| 2018 | $8,972 | $711,400 | $355,700 | $355,700 |
| 2017 | $8,568 | $697,452 | $348,726 | $348,726 |
| 2016 | $8,415 | $683,780 | $341,890 | $341,890 |
| 2015 | $8,310 | $673,512 | $336,756 | $336,756 |
| 2014 | $8,092 | $660,320 | $330,160 | $330,160 |
Source: Public Records
Map
Nearby Homes
- 384 Faxon Ave Unit 10
- 271 Granada Ave
- 231 Brighton Ave
- 137 Holloway Ave
- 133 Holloway Ave
- 116 Brighton Ave
- 189 Lee Ave
- 306 Ashton Ave
- 191 Thrift St
- 24 Josiah Ave
- 40 Pico Ave
- 1920 Ocean Ave Unit 1E
- 5000 Summit St
- 271 Montana St
- 252 Minerva St
- 150 De Soto St
- 63 Minerva St
- 20 Sargent St
- 430 Garfield St
- 77 Caine Ave