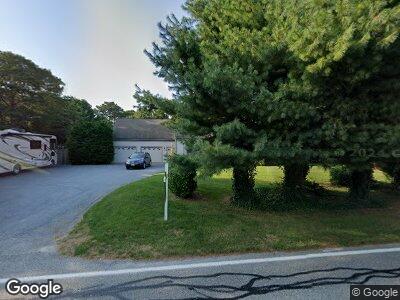
44 Bay Rd Harwich, MA 02645
Estimated Value: $878,000 - $1,079,047
5
Beds
3
Baths
2,649
Sq Ft
$369/Sq Ft
Est. Value
About This Home
This home is located at 44 Bay Rd, Harwich, MA 02645 and is currently estimated at $978,762, approximately $369 per square foot. 44 Bay Rd is a home located in Barnstable County with nearby schools including Harwich Elementary School, Chatham Elementary School, and Monomoy Regional Middle School.
Ownership History
Date
Name
Owned For
Owner Type
Purchase Details
Closed on
Nov 6, 2013
Sold by
Phyllis K Howard Ret
Bought by
Johnson Carl R and Johnson Gina M
Current Estimated Value
Create a Home Valuation Report for This Property
The Home Valuation Report is an in-depth analysis detailing your home's value as well as a comparison with similar homes in the area
Home Values in the Area
Average Home Value in this Area
Purchase History
| Date | Buyer | Sale Price | Title Company |
|---|---|---|---|
| Johnson Carl R | $5,675 | -- |
Source: Public Records
Mortgage History
| Date | Status | Borrower | Loan Amount |
|---|---|---|---|
| Open | Johnson Carl R | $199,000 | |
| Closed | Johnson Carl R | $108,000 | |
| Previous Owner | Johnson Carl R | $100,000 | |
| Previous Owner | Johnson Carl R | $257,200 | |
| Previous Owner | Johnson Carl R | $100,000 | |
| Previous Owner | Johnson Carl R | $230,000 |
Source: Public Records
Tax History Compared to Growth
Tax History
| Year | Tax Paid | Tax Assessment Tax Assessment Total Assessment is a certain percentage of the fair market value that is determined by local assessors to be the total taxable value of land and additions on the property. | Land | Improvement |
|---|---|---|---|---|
| 2025 | $5,603 | $948,000 | $265,500 | $682,500 |
| 2024 | $5,291 | $877,400 | $225,400 | $652,000 |
| 2023 | $5,039 | $758,900 | $204,900 | $554,000 |
| 2022 | $4,868 | $600,200 | $178,200 | $422,000 |
| 2021 | $4,911 | $571,100 | $162,000 | $409,100 |
| 2020 | $4,853 | $555,900 | $160,200 | $395,700 |
| 2019 | $4,654 | $536,800 | $154,000 | $382,800 |
| 2018 | $4,182 | $506,800 | $140,000 | $366,800 |
| 2017 | $4,341 | $484,000 | $127,700 | $356,300 |
| 2016 | $4,250 | $468,600 | $127,700 | $340,900 |
| 2015 | $4,222 | $470,700 | $125,200 | $345,500 |
| 2014 | $4,032 | $459,700 | $120,100 | $339,600 |
Source: Public Records
Map
Nearby Homes