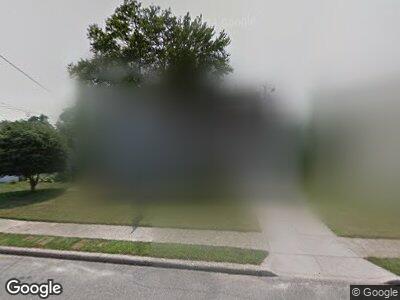
44 Birchbrook Dr Smithtown, NY 11787
Village of the Branch NeighborhoodEstimated Value: $668,000 - $718,000
4
Beds
2
Baths
1,420
Sq Ft
$489/Sq Ft
Est. Value
About This Home
This home is located at 44 Birchbrook Dr, Smithtown, NY 11787 and is currently estimated at $693,718, approximately $488 per square foot. 44 Birchbrook Dr is a home located in Suffolk County with nearby schools including Smithtown Elementary School, St Patrick Elementary School, and Smithtown Christian School.
Ownership History
Date
Name
Owned For
Owner Type
Purchase Details
Closed on
Nov 4, 2019
Sold by
Obanhein Sean and Jakimer Shannon
Bought by
Obanhen Sean and Obanhein Shannon
Current Estimated Value
Home Financials for this Owner
Home Financials are based on the most recent Mortgage that was taken out on this home.
Original Mortgage
$436,000
Interest Rate
3.65%
Mortgage Type
Stand Alone Refi Refinance Of Original Loan
Purchase Details
Closed on
Jul 31, 2018
Sold by
Roussis Renae S and Roussis Michael T
Bought by
Obanhein Sean and Jakimer Shannon
Home Financials for this Owner
Home Financials are based on the most recent Mortgage that was taken out on this home.
Original Mortgage
$422,750
Interest Rate
4.5%
Mortgage Type
Stand Alone Refi Refinance Of Original Loan
Create a Home Valuation Report for This Property
The Home Valuation Report is an in-depth analysis detailing your home's value as well as a comparison with similar homes in the area
Home Values in the Area
Average Home Value in this Area
Purchase History
| Date | Buyer | Sale Price | Title Company |
|---|---|---|---|
| Obanhen Sean | -- | None Available | |
| Obanhein Sean | $445,000 | -- |
Source: Public Records
Mortgage History
| Date | Status | Borrower | Loan Amount |
|---|---|---|---|
| Previous Owner | Obanhen Sean | $436,000 | |
| Previous Owner | Jakimer Shannon | $422,750 | |
| Previous Owner | Roussis Michael | $77,000 |
Source: Public Records
Tax History Compared to Growth
Tax History
| Year | Tax Paid | Tax Assessment Tax Assessment Total Assessment is a certain percentage of the fair market value that is determined by local assessors to be the total taxable value of land and additions on the property. | Land | Improvement |
|---|---|---|---|---|
| 2023 | $12,198 | $5,040 | $375 | $4,665 |
| 2022 | $6,151 | $5,040 | $375 | $4,665 |
| 2021 | $6,151 | $5,040 | $375 | $4,665 |
| 2020 | $18,819 | $5,040 | $375 | $4,665 |
| 2019 | $18,819 | $0 | $0 | $0 |
| 2018 | -- | $5,040 | $375 | $4,665 |
| 2017 | $6,273 | $5,040 | $375 | $4,665 |
| 2016 | $6,182 | $5,040 | $375 | $4,665 |
| 2015 | -- | $5,040 | $375 | $4,665 |
| 2014 | -- | $5,040 | $375 | $4,665 |
Source: Public Records
Map
Nearby Homes