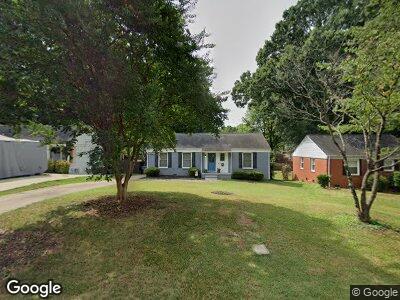
4409 Collingwood Dr Charlotte, NC 28209
Collingwood NeighborhoodEstimated Value: $488,000 - $548,000
3
Beds
2
Baths
1,263
Sq Ft
$411/Sq Ft
Est. Value
About This Home
This home is located at 4409 Collingwood Dr, Charlotte, NC 28209 and is currently estimated at $518,962, approximately $410 per square foot. 4409 Collingwood Dr is a home located in Mecklenburg County with nearby schools including Pinewood Elementary, Alexander Graham Middle, and Myers Park High.
Ownership History
Date
Name
Owned For
Owner Type
Purchase Details
Closed on
Nov 2, 2015
Sold by
Flanary Kyle W and Flanary Elizabeth
Bought by
Meuse Michael A and Meuse Megan C
Current Estimated Value
Home Financials for this Owner
Home Financials are based on the most recent Mortgage that was taken out on this home.
Original Mortgage
$193,600
Outstanding Balance
$155,785
Interest Rate
3.83%
Mortgage Type
New Conventional
Estimated Equity
$369,424
Purchase Details
Closed on
Jul 13, 2015
Sold by
Lane Gerald P and Lane Donna S
Bought by
Flanary Kyle W and Flanary Elizabeth
Home Financials for this Owner
Home Financials are based on the most recent Mortgage that was taken out on this home.
Original Mortgage
$96,000
Interest Rate
3.93%
Mortgage Type
New Conventional
Purchase Details
Closed on
Feb 5, 1974
Bought by
Lane Gerald P and Lane Donna S
Create a Home Valuation Report for This Property
The Home Valuation Report is an in-depth analysis detailing your home's value as well as a comparison with similar homes in the area
Home Values in the Area
Average Home Value in this Area
Purchase History
| Date | Buyer | Sale Price | Title Company |
|---|---|---|---|
| Meuse Michael A | $242,000 | None Available | |
| Flanary Kyle W | $120,000 | Attorney | |
| Lane Gerald P | -- | -- |
Source: Public Records
Mortgage History
| Date | Status | Borrower | Loan Amount |
|---|---|---|---|
| Open | Meuse Michael A | $193,600 | |
| Previous Owner | Flanary Kyle W | $96,000 | |
| Previous Owner | Lane Donna S | $86,300 | |
| Previous Owner | Lane Gerald P | $88,800 | |
| Previous Owner | Lane Gerald P | $59,174 | |
| Previous Owner | Lane Gerald P | $46,900 |
Source: Public Records
Tax History Compared to Growth
Tax History
| Year | Tax Paid | Tax Assessment Tax Assessment Total Assessment is a certain percentage of the fair market value that is determined by local assessors to be the total taxable value of land and additions on the property. | Land | Improvement |
|---|---|---|---|---|
| 2023 | $3,153 | $454,700 | $275,000 | $179,700 |
| 2022 | $3,153 | $326,700 | $200,000 | $126,700 |
| 2021 | $3,153 | $326,700 | $200,000 | $126,700 |
| 2020 | $3,260 | $326,700 | $200,000 | $126,700 |
| 2019 | $3,244 | $326,700 | $200,000 | $126,700 |
| 2018 | $2,350 | $173,500 | $75,000 | $98,500 |
| 2017 | $2,309 | $173,500 | $75,000 | $98,500 |
| 2016 | $2,299 | $134,700 | $75,000 | $59,700 |
| 2015 | $1,786 | $134,700 | $75,000 | $59,700 |
| 2014 | $1,912 | $144,000 | $75,000 | $69,000 |
Source: Public Records
Map
Nearby Homes
- 4311 Collingwood Dr
- 4224 Firwood Ln
- 576 Scaleybark Rd
- 614 Kenlough Dr
- 658 Manhasset Rd
- 1114 Hartford Ave
- 531 Manhasset Rd
- 3714 Conway Ave
- 814 Selwyn Oaks Ct Unit 9/A&B
- 732 Shawnee Dr
- 3505 Trent St
- 4141 Polluck Way
- 111 Verbena St Unit 10
- 115 Verbena St Unit 12
- 3516 Mill Stream Ct
- 4317 Ruskin Dr
- 4626 Fairbluff Place
- 3321 Auburn Ave
- 836 E Woodlawn Rd
- 842 E Woodlawn Rd