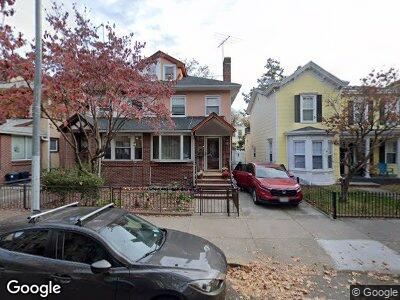
441 79th St Brooklyn, NY 11209
Bay Ridge NeighborhoodEstimated Value: $1,332,854 - $1,412,000
4
Beds
3
Baths
1,989
Sq Ft
$684/Sq Ft
Est. Value
About This Home
This home is located at 441 79th St, Brooklyn, NY 11209 and is currently estimated at $1,359,714, approximately $683 per square foot. 441 79th St is a home located in Kings County with nearby schools including P.S./I.S. 30 - The Mary White Ovington School, P.S. 127 McKinley Park, and Fort Hamilton High School.
Ownership History
Date
Name
Owned For
Owner Type
Purchase Details
Closed on
Mar 20, 2024
Sold by
Kurgansky Gene and Kurgansky Tanya
Bought by
Deng Ya Yi and Lin Ioi Wah
Current Estimated Value
Home Financials for this Owner
Home Financials are based on the most recent Mortgage that was taken out on this home.
Original Mortgage
$750,000
Outstanding Balance
$743,402
Interest Rate
6.77%
Mortgage Type
Purchase Money Mortgage
Estimated Equity
$567,244
Purchase Details
Closed on
Oct 25, 2000
Sold by
Ridge East Holdings Llc
Bought by
Kurgansky Gene and Kurgansky Tanya
Home Financials for this Owner
Home Financials are based on the most recent Mortgage that was taken out on this home.
Original Mortgage
$277,791
Interest Rate
9.31%
Mortgage Type
Purchase Money Mortgage
Purchase Details
Closed on
Jun 15, 2000
Sold by
Yeno Michael
Bought by
Ridge East Holdings Llc
Purchase Details
Closed on
May 22, 2000
Sold by
Weiss Jill
Bought by
Yeno Michael
Create a Home Valuation Report for This Property
The Home Valuation Report is an in-depth analysis detailing your home's value as well as a comparison with similar homes in the area
Home Values in the Area
Average Home Value in this Area
Purchase History
| Date | Buyer | Sale Price | Title Company |
|---|---|---|---|
| Deng Ya Yi | $1,315,000 | -- | |
| Deng Ya Yi | $1,315,000 | -- | |
| Kurgansky Gene | $309,000 | Fidelity National Title Ins | |
| Kurgansky Gene | $309,000 | Fidelity National Title Ins | |
| Ridge East Holdings Llc | $197,500 | Fidelity National Title Ins | |
| Ridge East Holdings Llc | $197,500 | Fidelity National Title Ins | |
| Yeno Michael | -- | Fidelity National Title Ins | |
| Yeno Michael | -- | Fidelity National Title Ins |
Source: Public Records
Mortgage History
| Date | Status | Borrower | Loan Amount |
|---|---|---|---|
| Open | Deng Ya Yi | $750,000 | |
| Closed | Deng Ya Yi | $750,000 | |
| Previous Owner | Kurgansky Gene | $347,269 | |
| Previous Owner | Kurgansky Gene | $176,329 | |
| Previous Owner | Kurgansky Gene | $250,000 | |
| Previous Owner | Kurgansky Gene | $19,896 | |
| Previous Owner | Kurgansky Gene | $99,800 | |
| Previous Owner | Kurgansky Gene | $277,791 |
Source: Public Records
Tax History Compared to Growth
Tax History
| Year | Tax Paid | Tax Assessment Tax Assessment Total Assessment is a certain percentage of the fair market value that is determined by local assessors to be the total taxable value of land and additions on the property. | Land | Improvement |
|---|---|---|---|---|
| 2024 | $9,698 | $62,040 | $15,360 | $46,680 |
| 2023 | $9,251 | $68,100 | $15,360 | $52,740 |
| 2022 | $8,580 | $69,540 | $15,360 | $54,180 |
| 2021 | $9,045 | $62,820 | $15,360 | $47,460 |
| 2020 | $6,783 | $62,100 | $15,360 | $46,740 |
| 2019 | $8,417 | $58,800 | $15,360 | $43,440 |
| 2018 | $7,738 | $37,960 | $8,201 | $29,759 |
| 2017 | $7,301 | $35,814 | $9,159 | $26,655 |
| 2016 | $7,160 | $35,814 | $11,033 | $24,781 |
| 2015 | $4,075 | $35,542 | $13,808 | $21,734 |
| 2014 | $4,075 | $33,531 | $12,714 | $20,817 |
Source: Public Records
Map
Nearby Homes
- 437 79th St
- 444 78th St
- 7825 4th Ave Unit E10
- 7825 4th Ave Unit F-9
- 7901 4th Ave Unit C-21
- 7901 4th Ave Unit E-10
- 7901 4th Ave Unit A18
- 427 78th St
- 436 77th St
- 473 77th St
- 429 81st St
- 8020 4th Ave Unit D5
- 511 79th St
- 7612 5th Ave
- 436 76th St
- 509 80th St
- 7609 4th Ave Unit C11
- 7609 4th Ave Unit B11
- 7609 4th Ave Unit D11
- 530 79th St