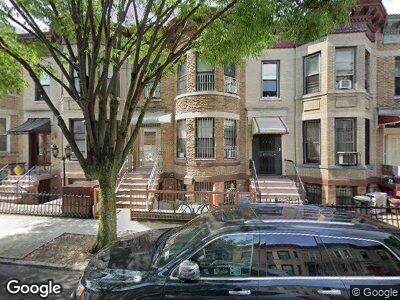
446 62nd St Brooklyn, NY 11220
Sunset Park NeighborhoodEstimated Value: $1,337,000 - $1,529,000
--
Bed
--
Bath
2,080
Sq Ft
$688/Sq Ft
Est. Value
About This Home
This home is located at 446 62nd St, Brooklyn, NY 11220 and is currently estimated at $1,430,419, approximately $687 per square foot. 446 62nd St is a home located in Kings County with nearby schools including P.S. 971 School of Math, Science, and Healthy Living, Junior High School 227 Edward B Shallow, and Fort Hamilton High School.
Ownership History
Date
Name
Owned For
Owner Type
Purchase Details
Closed on
Aug 28, 2024
Sold by
Chen Mei Lan and Chen Meiming
Bought by
Jiang Feng and Jiang Jian
Current Estimated Value
Purchase Details
Closed on
Oct 21, 2015
Sold by
Jiang Zhu
Bought by
Chen Mei Lan and Chen Meiming
Home Financials for this Owner
Home Financials are based on the most recent Mortgage that was taken out on this home.
Original Mortgage
$475,000
Interest Rate
3.88%
Purchase Details
Closed on
Dec 3, 2014
Sold by
44662 Amg Inc
Bought by
Jiang Zhu
Home Financials for this Owner
Home Financials are based on the most recent Mortgage that was taken out on this home.
Original Mortgage
$475,000
Interest Rate
4.02%
Mortgage Type
New Conventional
Purchase Details
Closed on
Jul 21, 2014
Sold by
Cassin Dennis J
Bought by
44662 Amg Inc
Create a Home Valuation Report for This Property
The Home Valuation Report is an in-depth analysis detailing your home's value as well as a comparison with similar homes in the area
Home Values in the Area
Average Home Value in this Area
Purchase History
| Date | Buyer | Sale Price | Title Company |
|---|---|---|---|
| Jiang Feng | -- | -- | |
| Chen Mei Lan | $950,000 | -- | |
| Chen Mei Lan | $950,000 | -- | |
| Jiang Zhu | $850,000 | -- | |
| Jiang Zhu | $850,000 | -- | |
| 44662 Amg Inc | $680,000 | -- | |
| 44662 Amg Inc | $680,000 | -- |
Source: Public Records
Mortgage History
| Date | Status | Borrower | Loan Amount |
|---|---|---|---|
| Previous Owner | Chen Mei Lan | $475,000 | |
| Previous Owner | Jiang Zhu | $475,000 |
Source: Public Records
Tax History Compared to Growth
Tax History
| Year | Tax Paid | Tax Assessment Tax Assessment Total Assessment is a certain percentage of the fair market value that is determined by local assessors to be the total taxable value of land and additions on the property. | Land | Improvement |
|---|---|---|---|---|
| 2024 | $8,571 | $84,240 | $16,380 | $67,860 |
| 2023 | $8,179 | $80,520 | $16,380 | $64,140 |
| 2022 | $7,588 | $71,760 | $16,380 | $55,380 |
| 2021 | $7,548 | $69,120 | $16,380 | $52,740 |
| 2020 | $3,748 | $76,320 | $16,380 | $59,940 |
| 2019 | $7,439 | $80,340 | $16,380 | $63,960 |
| 2018 | $6,841 | $33,560 | $7,946 | $25,614 |
| 2017 | $6,457 | $31,677 | $8,842 | $22,835 |
| 2016 | $5,975 | $29,887 | $9,411 | $20,476 |
| 2015 | $3,385 | $29,859 | $9,761 | $20,098 |
| 2014 | $3,385 | $29,635 | $10,089 | $19,546 |
Source: Public Records