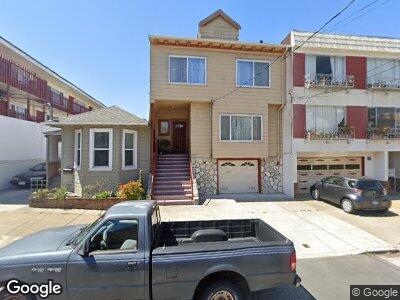
449 31st Ave San Francisco, CA 94121
Central Richmond NeighborhoodEstimated Value: $1,480,000 - $1,870,000
4
Beds
2
Baths
1,575
Sq Ft
$1,041/Sq Ft
Est. Value
About This Home
This home is located at 449 31st Ave, San Francisco, CA 94121 and is currently estimated at $1,640,224, approximately $1,041 per square foot. 449 31st Ave is a home located in San Francisco County with nearby schools including Alamo Elementary School, Presidio Middle School, and Katherine Delmar Burke School.
Ownership History
Date
Name
Owned For
Owner Type
Purchase Details
Closed on
Jul 20, 2010
Sold by
Eberitzsch Eun Joo
Bought by
Shin Hye Kyung and Lee Kyu S
Current Estimated Value
Home Financials for this Owner
Home Financials are based on the most recent Mortgage that was taken out on this home.
Original Mortgage
$270,000
Outstanding Balance
$183,460
Interest Rate
4.71%
Mortgage Type
Seller Take Back
Estimated Equity
$1,463,673
Create a Home Valuation Report for This Property
The Home Valuation Report is an in-depth analysis detailing your home's value as well as a comparison with similar homes in the area
Home Values in the Area
Average Home Value in this Area
Purchase History
| Date | Buyer | Sale Price | Title Company |
|---|---|---|---|
| Shin Hye Kyung | $500,000 | First American Title Company |
Source: Public Records
Mortgage History
| Date | Status | Borrower | Loan Amount |
|---|---|---|---|
| Open | Shin Hye Kyung | $270,000 |
Source: Public Records
Tax History Compared to Growth
Tax History
| Year | Tax Paid | Tax Assessment Tax Assessment Total Assessment is a certain percentage of the fair market value that is determined by local assessors to be the total taxable value of land and additions on the property. | Land | Improvement |
|---|---|---|---|---|
| 2024 | $8,253 | $628,002 | $439,604 | $188,398 |
| 2023 | $8,077 | $615,690 | $430,986 | $184,704 |
| 2022 | $7,906 | $603,620 | $422,536 | $181,084 |
| 2021 | $7,764 | $591,786 | $414,252 | $177,534 |
| 2020 | $7,862 | $585,720 | $410,006 | $175,714 |
| 2019 | $7,599 | $574,238 | $401,968 | $172,270 |
| 2018 | $7,343 | $562,982 | $394,088 | $168,894 |
| 2017 | $6,959 | $551,946 | $386,362 | $165,584 |
| 2016 | $6,825 | $541,126 | $378,788 | $162,338 |
| 2015 | $6,738 | $533,000 | $373,100 | $159,900 |
| 2014 | $6,563 | $522,560 | $365,792 | $156,768 |
Source: Public Records
Map
Nearby Homes