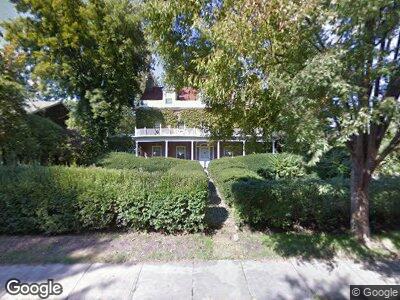
45 North Dr Great Neck, NY 11021
Estimated Value: $1,870,000
6
Beds
6
Baths
6,014
Sq Ft
$311/Sq Ft
Est. Value
About This Home
This home is located at 45 North Dr, Great Neck, NY 11021 and is currently estimated at $1,870,000, approximately $310 per square foot. 45 North Dr is a home located in Nassau County with nearby schools including Elizabeth M. Baker Elementary School, Great Neck North Middle School, and Great Neck South Middle School.
Ownership History
Date
Name
Owned For
Owner Type
Purchase Details
Closed on
Mar 20, 2023
Sold by
Euroland 3 Ltd
Bought by
Holding 45 Llc
Current Estimated Value
Home Financials for this Owner
Home Financials are based on the most recent Mortgage that was taken out on this home.
Original Mortgage
$1,800,000
Interest Rate
6.32%
Mortgage Type
Purchase Money Mortgage
Purchase Details
Closed on
Oct 20, 2022
Sold by
Kensington Restorations Llc
Bought by
Euroland 3 Ltd
Purchase Details
Closed on
Jul 14, 2015
Sold by
Ezair Janet and Ezair Khedouri
Bought by
Kensington Restorations Llc
Purchase Details
Closed on
Nov 25, 2013
Sold by
Ezair Khedouri and Ezair Janey
Bought by
Ezair Khedouri
Create a Home Valuation Report for This Property
The Home Valuation Report is an in-depth analysis detailing your home's value as well as a comparison with similar homes in the area
Home Values in the Area
Average Home Value in this Area
Purchase History
| Date | Buyer | Sale Price | Title Company |
|---|---|---|---|
| Holding 45 Llc | -- | Fidelity Title Insurance Co | |
| Holding 45 Llc | -- | Fidelity Title Insurance Co | |
| Euroland 3 Ltd | $1,300,000 | Imperial Abstract Corp | |
| Euroland 3 Ltd | $1,300,000 | Imperial Abstract Corp | |
| Kensington Restorations Llc | $1,350,000 | None Available | |
| Ezair Khedouri | -- | -- |
Source: Public Records
Mortgage History
| Date | Status | Borrower | Loan Amount |
|---|---|---|---|
| Open | Holding 45 Llc | $1,800,000 | |
| Closed | Holding 45 Llc | $1,800,000 | |
| Previous Owner | Kensington Restorations Llc | $950,000 | |
| Previous Owner | Kensington Restorations Llc | $350,000 | |
| Previous Owner | Kensington Restorations Llc | $1,000,000 |
Source: Public Records
Tax History Compared to Growth
Tax History
| Year | Tax Paid | Tax Assessment Tax Assessment Total Assessment is a certain percentage of the fair market value that is determined by local assessors to be the total taxable value of land and additions on the property. | Land | Improvement |
|---|---|---|---|---|
| 2024 | $6,193 | $1,727 | $678 | $1,727 |
| 2023 | $30,678 | $1,782 | $885 | $897 |
| 2022 | $30,678 | $1,758 | $678 | $1,080 |
| 2021 | $21,464 | $1,836 | $680 | $1,156 |
| 2020 | $21,464 | $3,150 | $2,144 | $1,006 |
| 2019 | $32,177 | $3,375 | $2,172 | $1,203 |
| 2018 | $32,177 | $3,570 | $0 | $0 |
| 2017 | $23,035 | $3,570 | $1,864 | $1,706 |
| 2016 | $30,590 | $4,400 | $2,297 | $2,103 |
| 2015 | $9,104 | $4,400 | $2,297 | $2,103 |
| 2014 | $9,104 | $4,400 | $2,297 | $2,103 |
| 2013 | $8,686 | $4,400 | $2,297 | $2,103 |
Source: Public Records
Map
Nearby Homes
- 45 Nassau Dr
- 28 Nassau Dr
- 1 Kensington Ct Unit 223
- 25 Chapel Place Unit 1L
- 40 Stoner Ave Unit 2Cc
- 30 Stoner Ave Unit 3R
- 66A Wooleys Ln
- 21 Chapel Place Unit 1K
- 20 Chapel Place Unit 1ST
- 20 Chapel Place Unit 1MN
- 20 Chapel Place Unit 2C
- 36 Barstow Rd Unit La
- 149 Wooleys Ln
- 4 Imperial Ct
- 30 Barstow Rd Unit 2C
- 25 Park Place Unit 1K
- 25 Park Place Unit 1Ee
- 37 Devon Rd
- 81 Station Rd
- 21 Barstow Rd