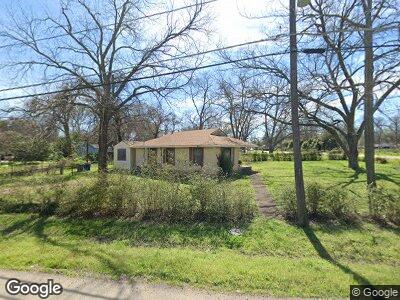
4500 Hedgdon Dr Dallas, TX 75216
Fruitdale NeighborhoodEstimated Value: $170,596 - $233,000
2
Beds
1
Bath
1,300
Sq Ft
$155/Sq Ft
Est. Value
About This Home
This home is located at 4500 Hedgdon Dr, Dallas, TX 75216 and is currently estimated at $201,649, approximately $155 per square foot. 4500 Hedgdon Dr is a home located in Dallas County with nearby schools including Elisha M. Pease Elementary School, Dr. Frederick Douglass Todd Sr., and South Oak Cliff High School.
Ownership History
Date
Name
Owned For
Owner Type
Purchase Details
Closed on
Sep 6, 2002
Sold by
Anumel James
Bought by
Mason Judy
Current Estimated Value
Home Financials for this Owner
Home Financials are based on the most recent Mortgage that was taken out on this home.
Original Mortgage
$47,623
Interest Rate
6.21%
Mortgage Type
FHA
Purchase Details
Closed on
Feb 10, 1999
Sold by
Lowe Gregory and Lowe Melvlyn
Bought by
Anumel James
Home Financials for this Owner
Home Financials are based on the most recent Mortgage that was taken out on this home.
Original Mortgage
$37,800
Interest Rate
6.8%
Mortgage Type
Unknown
Purchase Details
Closed on
Feb 18, 1994
Sold by
Cisneros Henry G
Bought by
Lowe Gregory and Lowe Melvlyn
Home Financials for this Owner
Home Financials are based on the most recent Mortgage that was taken out on this home.
Original Mortgage
$20,800
Interest Rate
7%
Mortgage Type
FHA
Create a Home Valuation Report for This Property
The Home Valuation Report is an in-depth analysis detailing your home's value as well as a comparison with similar homes in the area
Home Values in the Area
Average Home Value in this Area
Purchase History
| Date | Buyer | Sale Price | Title Company |
|---|---|---|---|
| Mason Judy | -- | -- | |
| Anumel James | -- | -- | |
| Lowe Gregory | -- | -- |
Source: Public Records
Mortgage History
| Date | Status | Borrower | Loan Amount |
|---|---|---|---|
| Open | Mason Judy | $51,359 | |
| Closed | Mason Judy | $47,623 | |
| Previous Owner | Anumel James | $37,800 | |
| Previous Owner | Anumel James | $37,800 | |
| Previous Owner | Lowe Gregory | $20,800 |
Source: Public Records
Tax History Compared to Growth
Tax History
| Year | Tax Paid | Tax Assessment Tax Assessment Total Assessment is a certain percentage of the fair market value that is determined by local assessors to be the total taxable value of land and additions on the property. | Land | Improvement |
|---|---|---|---|---|
| 2023 | $2,146 | $80,000 | $35,000 | $45,000 |
| 2022 | $2,375 | $95,000 | $35,000 | $60,000 |
| 2021 | $2,100 | $79,620 | $30,000 | $49,620 |
| 2020 | $1,628 | $64,540 | $0 | $0 |
| 2019 | $1,707 | $60,000 | $30,000 | $30,000 |
| 2018 | $952 | $35,000 | $15,000 | $20,000 |
| 2017 | $952 | $35,000 | $15,000 | $20,000 |
| 2016 | $1,063 | $39,100 | $12,000 | $27,100 |
| 2015 | $1,073 | $39,100 | $12,000 | $27,100 |
| 2014 | $1,073 | $39,100 | $12,000 | $27,100 |
Source: Public Records
Map
Nearby Homes
- 4421 Vandervort Dr
- 4521 Vandervort Dr
- 3321 Seaton Dr
- 4533 Vandervort Dr
- 4331 Kolloch Dr
- 3322 Marjorie Ave
- 4614 Kolloch Dr
- Seaton Dr Seaton Dr
- 3901 Le May Ave
- 3444 Kristen Dr
- 4506 Cranfill Dr
- 4732 Springer St
- 4205 Humphrey Dr
- 4203 Humphrey Dr
- 4606 Haas Dr
- 2931 Linfield Rd
- 3500 S Ledbetter Dr
- 4841 Bromfield St
- 4848 Haas Dr
- 3111 51st St