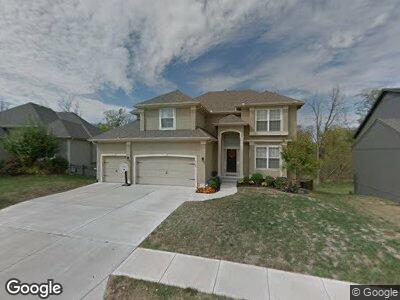
4524 N 110th St Kansas City, KS 66109
I-435 West KC-KS NeighborhoodEstimated Value: $412,000 - $499,000
4
Beds
3
Baths
2,358
Sq Ft
$194/Sq Ft
Est. Value
About This Home
This home is located at 4524 N 110th St, Kansas City, KS 66109 and is currently estimated at $456,564, approximately $193 per square foot. 4524 N 110th St is a home located in Wyandotte County with nearby schools including Piper Prairie Elementary School, Piper East Elementary School, and Piper Middle School.
Ownership History
Date
Name
Owned For
Owner Type
Purchase Details
Closed on
Dec 26, 2012
Sold by
Evans Sandra L and Evans Timothy E
Bought by
Evans Sandra L and Evans Timothy E
Current Estimated Value
Home Financials for this Owner
Home Financials are based on the most recent Mortgage that was taken out on this home.
Original Mortgage
$256,500
Outstanding Balance
$152,389
Interest Rate
3.44%
Mortgage Type
New Conventional
Estimated Equity
$304,175
Purchase Details
Closed on
Aug 29, 2006
Sold by
Mack Colt Homes Inc
Bought by
Hogan Sandra L and Evans Timothy E
Home Financials for this Owner
Home Financials are based on the most recent Mortgage that was taken out on this home.
Original Mortgage
$270,702
Interest Rate
6.79%
Mortgage Type
Purchase Money Mortgage
Purchase Details
Closed on
Nov 1, 2005
Sold by
Western Wyandotte Investors Llc
Bought by
Mack Colt Homes Inc
Home Financials for this Owner
Home Financials are based on the most recent Mortgage that was taken out on this home.
Original Mortgage
$210,000
Interest Rate
5.75%
Mortgage Type
Credit Line Revolving
Create a Home Valuation Report for This Property
The Home Valuation Report is an in-depth analysis detailing your home's value as well as a comparison with similar homes in the area
Home Values in the Area
Average Home Value in this Area
Purchase History
| Date | Buyer | Sale Price | Title Company |
|---|---|---|---|
| Evans Sandra L | -- | None Available | |
| Hogan Sandra L | -- | Old Republic Title | |
| Mack Colt Homes Inc | -- | Old Republic Title |
Source: Public Records
Mortgage History
| Date | Status | Borrower | Loan Amount |
|---|---|---|---|
| Open | Evans Sandra L | $256,500 | |
| Closed | Hogan Sandra L | $270,702 | |
| Previous Owner | Mack Colt Homes Inc | $210,000 |
Source: Public Records
Tax History Compared to Growth
Tax History
| Year | Tax Paid | Tax Assessment Tax Assessment Total Assessment is a certain percentage of the fair market value that is determined by local assessors to be the total taxable value of land and additions on the property. | Land | Improvement |
|---|---|---|---|---|
| 2024 | $7,625 | $47,357 | $7,667 | $39,690 |
| 2023 | $8,185 | $47,231 | $6,455 | $40,776 |
| 2022 | $7,016 | $40,745 | $5,427 | $35,318 |
| 2021 | $6,573 | $38,790 | $5,819 | $32,971 |
| 2020 | $6,097 | $36,122 | $5,373 | $30,749 |
| 2019 | $5,973 | $35,413 | $5,198 | $30,215 |
| 2018 | $6,006 | $34,719 | $5,595 | $29,124 |
| 2017 | $5,374 | $31,467 | $6,072 | $25,395 |
| 2016 | $5,270 | $30,551 | $6,071 | $24,480 |
| 2015 | $5,264 | $29,952 | $6,071 | $23,881 |
| 2014 | $4,721 | $29,364 | $6,071 | $23,293 |
Source: Public Records
Map
Nearby Homes
- 4603 N 111th St
- 10811 Augusta Dr
- 11035 Northridge Dr
- 10542 Clubhouse Dr
- SWC I-435 & Leavenworth Rd
- 3916 N 99th St
- 12838 Hubbard Rd
- 5118 N 108th St
- 11111 Winchester Dr
- 5105 N 115th St
- 3979 Hutton Rd
- 10230 Hollingsworth Rd
- 11600 Donahoo Rd
- 11116 Whispering Ln
- 3641 N 110th Terrace
- 3640 N 110th Terrace
- 3639 N 110th Terrace
- 3636 N 110th Terrace
- 3630 N 110th Terrace
- 3637 N 110th Terrace