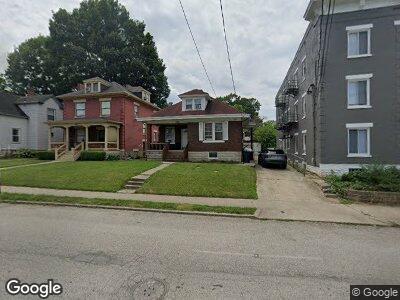
4569 Smith Rd Cincinnati, OH 45212
Estimated Value: $233,000 - $270,386
3
Beds
2
Baths
1,192
Sq Ft
$211/Sq Ft
Est. Value
About This Home
This home is located at 4569 Smith Rd, Cincinnati, OH 45212 and is currently estimated at $251,847, approximately $211 per square foot. 4569 Smith Rd is a home located in Hamilton County with nearby schools including Norwood High School, Cornerstone Christian Academy, and Immaculate Conception Academy.
Create a Home Valuation Report for This Property
The Home Valuation Report is an in-depth analysis detailing your home's value as well as a comparison with similar homes in the area
Home Values in the Area
Average Home Value in this Area
Mortgage History
| Date | Status | Borrower | Loan Amount |
|---|---|---|---|
| Closed | Leach Rick | $35,000 | |
| Open | Leach Ricky Lynn | $106,000 | |
| Closed | Leach Ricky L | $91,000 | |
| Closed | Leach Ricky Lynn | $48,000 | |
| Closed | Leach Ricky Lynn | $21,300 | |
| Closed | Leach Ricky L | $37,000 |
Source: Public Records
Tax History Compared to Growth
Tax History
| Year | Tax Paid | Tax Assessment Tax Assessment Total Assessment is a certain percentage of the fair market value that is determined by local assessors to be the total taxable value of land and additions on the property. | Land | Improvement |
|---|---|---|---|---|
| 2024 | $3,473 | $68,831 | $26,887 | $41,944 |
| 2023 | $3,564 | $68,831 | $26,887 | $41,944 |
| 2022 | $2,801 | $45,392 | $12,194 | $33,198 |
| 2021 | $2,715 | $45,392 | $12,194 | $33,198 |
| 2020 | $2,721 | $45,392 | $12,194 | $33,198 |
| 2019 | $2,586 | $39,816 | $10,696 | $29,120 |
| 2018 | $2,589 | $39,816 | $10,696 | $29,120 |
| 2017 | $2,447 | $39,816 | $10,696 | $29,120 |
| 2016 | $2,320 | $36,439 | $10,696 | $25,743 |
| 2015 | $2,865 | $36,439 | $10,696 | $25,743 |
| 2014 | $2,062 | $36,439 | $10,696 | $25,743 |
| 2013 | $2,040 | $36,439 | $10,696 | $25,743 |
Source: Public Records
Map
Nearby Homes
- 2068 Elm Ave
- 2319 Monroe Ave
- 2033 Maple Ave
- 2533 Ida Ave
- 2435 Williams Ave
- 2033 Foraker Ave
- 4417 Allison St
- 4020 Forest Ave
- 2012 Crown Ave
- 1901 Sherman Ave
- 2604 Melrose Ave
- 2013 Hopkins Ave
- 3935 Forest Ave
- 4808 Beech St
- 3935 S Jefferson Ave
- 3955 Elsmere Ave
- 3933 Grove Ave
- 3954 Spencer Ave
- 5108 Silver St
- 1817 Sherman Ave