S
Seller's Agent in 2024
Susie Parkin
Sotheby's International Realty
(203) 524-4652
6 in this area
18 Total Sales
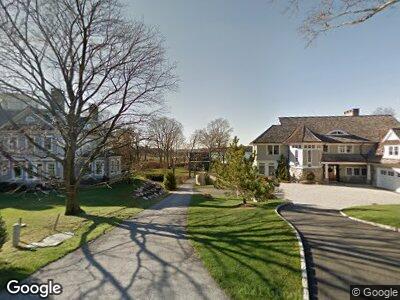
Enjoy Summer in this beautiful modern waterfront home, stunning views
| Date | Event | Price | Change | Sq Ft Price |
|---|---|---|---|---|
| 06/26/2024 06/26/24 | Rented | $20,000 | 0.0% | -- |
| 05/14/2024 05/14/24 | For Rent | $20,000 | 0.0% | -- |
| 12/08/2023 12/08/23 | Rented | $20,000 | 0.0% | -- |
| 09/01/2023 09/01/23 | For Rent | $20,000 | 0.0% | -- |
| 07/10/2023 07/10/23 | Sold | $5,400,000 | -0.9% | $1,620 / Sq Ft |
| 05/10/2023 05/10/23 | Pending | -- | -- | -- |
| 04/17/2023 04/17/23 | Price Changed | $5,450,000 | -8.4% | $1,635 / Sq Ft |
| 03/21/2023 03/21/23 | For Sale | $5,950,000 | 0.0% | $1,785 / Sq Ft |
| 01/31/2022 01/31/22 | Rented | $21,500 | 0.0% | -- |
| 01/31/2022 01/31/22 | Rented | $21,500 | +19.4% | -- |
| 01/31/2022 01/31/22 | Under Contract | -- | -- | -- |
| 01/31/2022 01/31/22 | Under Contract | -- | -- | -- |
| 11/08/2021 11/08/21 | Price Changed | $18,000 | -20.0% | $5 / Sq Ft |
| 10/25/2021 10/25/21 | Price Changed | $22,500 | -10.0% | $7 / Sq Ft |
| 08/10/2021 08/10/21 | For Rent | $25,000 | -13.8% | -- |
| 05/26/2021 05/26/21 | For Rent | $29,000 | 0.0% | -- |
| 03/15/2012 03/15/12 | Sold | $5,000,000 | -6.5% | $1,500 / Sq Ft |
| 03/15/2012 03/15/12 | Pending | -- | -- | -- |
| 03/15/2012 03/15/12 | For Sale | $5,350,000 | -- | $1,605 / Sq Ft |
| Year | Tax Paid | Tax Assessment Tax Assessment Total Assessment is a certain percentage of the fair market value that is determined by local assessors to be the total taxable value of land and additions on the property. | Land | Improvement |
|---|---|---|---|---|
| 2021 | $44,401 | $3,753,260 | $3,419,430 | $333,830 |
S
Seller's Agent in 2024
Susie Parkin
Sotheby's International Realty
(203) 524-4652
6 in this area
18 Total Sales

Buyer's Agent in 2024
Hyleri Katzenberg
Compass Connecticut, LLC
(203) 246-8395
65 Total Sales
Seller's Agent in 2023
Ann Simpson
BHHS New England Properties
(203) 940-0779
33 in this area
73 Total Sales
O
Buyer's Agent in 2023
OUT-OF-TOWN BROKER
FOREIGN LISTING
Seller's Agent in 2022
Emile de Neree
Compass Connecticut, LLC
(914) 572-4526
11 Total Sales
C
Buyer's Agent in 2012
Cristy Fraser
Coldwell Banker Realty