46 Lane St Unit 1 Lowell, MA 01851
Lower Highlands NeighborhoodEstimated Value: $579,013 - $661,000
3
Beds
1
Bath
1,250
Sq Ft
$502/Sq Ft
Est. Value
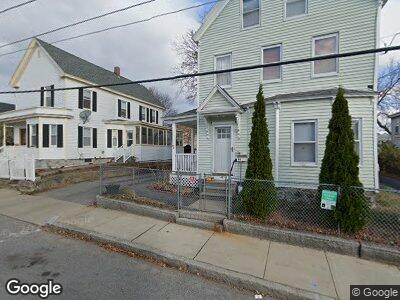
About This Home
This home is located at 46 Lane St Unit 1, Lowell, MA 01851 and is currently estimated at $627,253, approximately $501 per square foot. 46 Lane St Unit 1 is a home located in Middlesex County with nearby schools including Charles W. Morey Elementary School, Abraham Lincoln Elementary School, and Charlotte M Murkland Elementary School.
Ownership History
Date
Name
Owned For
Owner Type
Purchase Details
Closed on
Oct 31, 2017
Sold by
Cox Joshua A and Spence-Cox Pattian S
Bought by
37 Dover Street Llc
Current Estimated Value
Home Financials for this Owner
Home Financials are based on the most recent Mortgage that was taken out on this home.
Original Mortgage
$282,000
Outstanding Balance
$238,677
Interest Rate
3.78%
Mortgage Type
New Conventional
Estimated Equity
$388,576
Purchase Details
Closed on
Dec 26, 2000
Sold by
Richards Sandra B
Bought by
Cox Joshua A and Spence-Cox Pattian S
Home Financials for this Owner
Home Financials are based on the most recent Mortgage that was taken out on this home.
Original Mortgage
$147,150
Interest Rate
7.71%
Mortgage Type
Purchase Money Mortgage
Create a Home Valuation Report for This Property
The Home Valuation Report is an in-depth analysis detailing your home's value as well as a comparison with similar homes in the area
Home Values in the Area
Average Home Value in this Area
Purchase History
| Date | Buyer | Sale Price | Title Company |
|---|---|---|---|
| 37 Dover Street Llc | $376,000 | -- | |
| Cox Joshua A | $154,900 | -- | |
| Cox Joshua A | $154,900 | -- |
Source: Public Records
Mortgage History
| Date | Status | Borrower | Loan Amount |
|---|---|---|---|
| Open | 37 Dover Street Llc | $282,000 | |
| Closed | Cox Joshua A | $282,000 | |
| Previous Owner | Cox Joshua A | $185,000 | |
| Previous Owner | Cox Joshua A | $188,500 | |
| Previous Owner | Cox Joshua A | $147,150 |
Source: Public Records
Tax History Compared to Growth
Tax History
| Year | Tax Paid | Tax Assessment Tax Assessment Total Assessment is a certain percentage of the fair market value that is determined by local assessors to be the total taxable value of land and additions on the property. | Land | Improvement |
|---|---|---|---|---|
| 2025 | $6,668 | $580,800 | $120,100 | $460,700 |
| 2024 | $6,192 | $519,900 | $112,300 | $407,600 |
| 2023 | $5,767 | $464,300 | $97,600 | $366,700 |
| 2022 | $5,191 | $409,100 | $77,100 | $332,000 |
| 2021 | $4,821 | $358,200 | $67,100 | $291,100 |
| 2020 | $4,485 | $335,700 | $67,100 | $268,600 |
| 2019 | $4,184 | $298,000 | $63,800 | $234,200 |
| 2018 | $3,898 | $270,900 | $60,800 | $210,100 |
| 2017 | $3,743 | $250,900 | $58,900 | $192,000 |
| 2016 | $3,740 | $246,700 | $54,700 | $192,000 |
| 2015 | $3,105 | $200,600 | $54,700 | $145,900 |
| 2013 | $2,856 | $190,300 | $65,600 | $124,700 |
Source: Public Records
Map
Nearby Homes
- 613 School St
- 117 Liberty St
- 211 Westford St
- 193 Smith St
- 15 Barclay St
- 210 Smith St Unit 9
- 43 Hastings St
- 110 Branch St Unit 7
- 712 School St
- 96 Grove St
- 99 Westford St
- 987 Middlesex St
- 6 Mcintyre St
- 114 Warwick St
- 12 Puffer St
- 30 Angle St Unit 35
- 1117 Middlesex St
- 342 Stevens St
- 201 Thorndike St Unit 27
- 43 Fletcher St