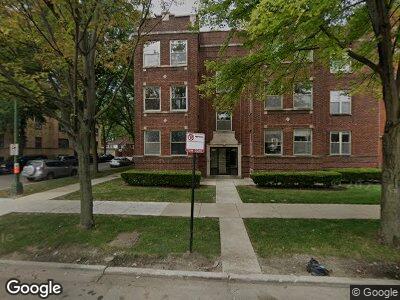
4600 N Central Park Ave Unit 46 Chicago, IL 60625
Albany Park NeighborhoodEstimated Value: $201,846 - $250,000
--
Bed
--
Bath
17,400
Sq Ft
$13/Sq Ft
Est. Value
About This Home
This home is located at 4600 N Central Park Ave Unit 46, Chicago, IL 60625 and is currently estimated at $232,212, approximately $13 per square foot. 4600 N Central Park Ave Unit 46 is a home located in Cook County with nearby schools including Haugan Elementary School, Roosevelt High School, and ASPIRA Haugan Middle School.
Ownership History
Date
Name
Owned For
Owner Type
Purchase Details
Closed on
Jul 13, 2021
Sold by
Larios Jonatan Jorio and Gimenez Cecilia Margarita
Bought by
Panasenko Zhanna
Current Estimated Value
Home Financials for this Owner
Home Financials are based on the most recent Mortgage that was taken out on this home.
Original Mortgage
$120,000
Outstanding Balance
$111,214
Interest Rate
2.9%
Mortgage Type
Commercial
Estimated Equity
$131,909
Purchase Details
Closed on
Jul 9, 2013
Sold by
Federal National Loan Mortgage Corp
Bought by
Larios Jonatan Lorio
Purchase Details
Closed on
Sep 14, 2012
Sold by
Motl Brent
Bought by
Federal Home Loan Mortgage Corporation
Purchase Details
Closed on
Apr 9, 2008
Sold by
Gps Holdings Vh Llc
Bought by
Motl Brent and Motl Jill R
Home Financials for this Owner
Home Financials are based on the most recent Mortgage that was taken out on this home.
Original Mortgage
$166,500
Interest Rate
6.12%
Mortgage Type
Unknown
Create a Home Valuation Report for This Property
The Home Valuation Report is an in-depth analysis detailing your home's value as well as a comparison with similar homes in the area
Home Values in the Area
Average Home Value in this Area
Purchase History
| Date | Buyer | Sale Price | Title Company |
|---|---|---|---|
| Panasenko Zhanna | $160,000 | Chicago Title | |
| Larios Jonatan Lorio | $105,000 | First American Title | |
| Federal Home Loan Mortgage Corporation | -- | None Available | |
| Motl Brent | $238,000 | Attorneys Title Guaranty Fun |
Source: Public Records
Mortgage History
| Date | Status | Borrower | Loan Amount |
|---|---|---|---|
| Open | Panasenko Zhanna | $120,000 | |
| Previous Owner | Motl Brent | $166,500 | |
| Previous Owner | Motl Brent | $59,475 |
Source: Public Records
Tax History Compared to Growth
Tax History
| Year | Tax Paid | Tax Assessment Tax Assessment Total Assessment is a certain percentage of the fair market value that is determined by local assessors to be the total taxable value of land and additions on the property. | Land | Improvement |
|---|---|---|---|---|
| 2024 | $3,947 | $24,422 | $2,690 | $21,732 |
| 2023 | $3,947 | $19,121 | $2,152 | $16,969 |
| 2022 | $3,947 | $19,121 | $2,152 | $16,969 |
| 2021 | $3,858 | $19,120 | $2,151 | $16,969 |
| 2020 | $2,937 | $13,138 | $1,114 | $12,024 |
| 2019 | $2,969 | $14,726 | $1,114 | $13,612 |
| 2018 | $2,918 | $14,726 | $1,114 | $13,612 |
| 2017 | $2,690 | $12,456 | $999 | $11,457 |
| 2016 | $2,503 | $12,456 | $999 | $11,457 |
| 2015 | $2,291 | $12,456 | $999 | $11,457 |
| 2014 | $3,625 | $19,464 | $922 | $18,542 |
| 2013 | $3,073 | $19,464 | $922 | $18,542 |
Source: Public Records
Map
Nearby Homes
- 4606 N Monticello Ave Unit 3N
- 3653 W Leland Ave Unit 1E
- 4700 N Monticello Ave Unit 102
- 4727 N Monticello Ave Unit 4
- 4511 N Saint Louis Ave
- 3440 W Leland Ave Unit 3W
- 4423 N Lawndale Ave Unit 1A
- 4515 N Hamlin Ave
- 3400 W Sunnyside Ave Unit 2
- 3611 W Montrose Ave Unit 406
- 4825 N Central Park Ave
- 4330 N Lawndale Ave
- 3343 W Sunnyside Ave Unit 3C
- 3517 W Ainslie St Unit G
- 4259 N Monticello Ave
- 4458 N Spaulding Ave
- 4249 N Central Park Ave
- 4322 N Kimball Ave
- 3707 W Cullom Ave Unit 1
- 4919 N Lawndale Ave