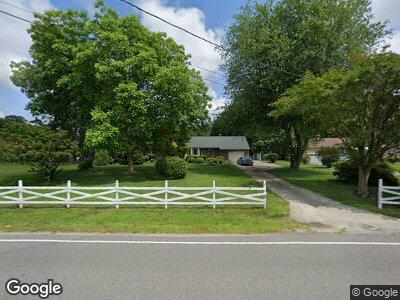
462 Whealton Rd Hampton, VA 23666
Northampton NeighborhoodEstimated Value: $305,394 - $313,000
2
Beds
2
Baths
1,436
Sq Ft
$216/Sq Ft
Est. Value
About This Home
This home is located at 462 Whealton Rd, Hampton, VA 23666 and is currently estimated at $310,349, approximately $216 per square foot. 462 Whealton Rd is a home located in Hampton City with nearby schools including Forrest Elementary School, Cesar Tarrant Middle School, and Bethel High School.
Ownership History
Date
Name
Owned For
Owner Type
Purchase Details
Closed on
Feb 15, 2022
Sold by
Andrea G Sanderson Living Trust
Bought by
Ballard Jerry M
Current Estimated Value
Home Financials for this Owner
Home Financials are based on the most recent Mortgage that was taken out on this home.
Original Mortgage
$270,072
Outstanding Balance
$254,559
Interest Rate
3.55%
Mortgage Type
VA
Estimated Equity
$55,790
Purchase Details
Closed on
Jan 21, 2022
Sold by
Sanderson Andrea G
Bought by
Andrea G Sanderson Living Trus
Home Financials for this Owner
Home Financials are based on the most recent Mortgage that was taken out on this home.
Original Mortgage
$270,072
Outstanding Balance
$254,559
Interest Rate
3.55%
Mortgage Type
VA
Estimated Equity
$55,790
Purchase Details
Closed on
Jan 18, 2022
Sold by
Elwin Sanderson
Bought by
Sanderson Andrea and Morzano Cheryl Leighann
Home Financials for this Owner
Home Financials are based on the most recent Mortgage that was taken out on this home.
Original Mortgage
$270,072
Outstanding Balance
$254,559
Interest Rate
3.55%
Mortgage Type
VA
Estimated Equity
$55,790
Create a Home Valuation Report for This Property
The Home Valuation Report is an in-depth analysis detailing your home's value as well as a comparison with similar homes in the area
Home Values in the Area
Average Home Value in this Area
Purchase History
| Date | Buyer | Sale Price | Title Company |
|---|---|---|---|
| Ballard Jerry M | $264,000 | Equity Title | |
| Andrea G Sanderson Living Trus | -- | None Listed On Document |
Source: Public Records
Mortgage History
| Date | Status | Borrower | Loan Amount |
|---|---|---|---|
| Open | Ballard Jerry M | $270,072 | |
| Previous Owner | Sanderson Elwin H | $29,000 |
Source: Public Records
Tax History Compared to Growth
Tax History
| Year | Tax Paid | Tax Assessment Tax Assessment Total Assessment is a certain percentage of the fair market value that is determined by local assessors to be the total taxable value of land and additions on the property. | Land | Improvement |
|---|---|---|---|---|
| 2024 | $3,288 | $285,900 | $69,600 | $216,300 |
| 2023 | $3,009 | $259,400 | $64,200 | $195,200 |
| 2022 | $2,946 | $249,700 | $64,200 | $185,500 |
| 2021 | $2,903 | $223,600 | $53,500 | $170,100 |
| 2020 | $2,546 | $205,300 | $53,500 | $151,800 |
| 2019 | $2,552 | $205,800 | $53,500 | $152,300 |
| 2018 | $2,550 | $196,400 | $53,500 | $142,900 |
| 2017 | $2,529 | $0 | $0 | $0 |
| 2016 | $2,501 | $194,100 | $0 | $0 |
| 2015 | $2,571 | $0 | $0 | $0 |
| 2014 | $2,561 | $199,800 | $50,900 | $148,900 |
Source: Public Records
Map
Nearby Homes
- 461 Joy Dr
- 455 Bonifay Dr
- 710 Big Bethel Rd
- 8711 Orcutt Ave
- 1108 Todds Ln
- 610 Big Bethel Rd
- 2 Bobs Ct
- 8530 Orcutt Ave
- 202 Florence Dr
- 204 Florence Dr
- 327 Nassau Place
- 5011 Arony St
- 8415 Orcutt Ave
- 102 Watermark Way
- 3 Woodlawn Dr
- 5018 Evelyn Ct
- 9 Emeraude Plage
- 804 Watermark Way
- 37 Lancaster Terrace
- 806 Watermark Way