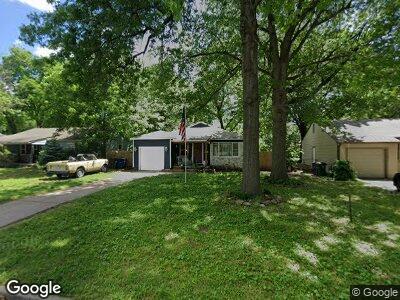
4647 S Rockford Ave Tulsa, OK 74105
Brookside NeighborhoodEstimated Value: $114,083 - $184,000
--
Bed
1
Bath
1,097
Sq Ft
$150/Sq Ft
Est. Value
About This Home
This home is located at 4647 S Rockford Ave, Tulsa, OK 74105 and is currently estimated at $164,521, approximately $149 per square foot. 4647 S Rockford Ave is a home located in Tulsa County with nearby schools including Eliot Elementary School, Edison Preparatory School, and Thomas Edison Preparatory High School.
Ownership History
Date
Name
Owned For
Owner Type
Purchase Details
Closed on
Sep 12, 2019
Sold by
Fairchild Rachael and Hewitt Brian
Bought by
Sanucci Anthony J and Edwards Denice A
Current Estimated Value
Home Financials for this Owner
Home Financials are based on the most recent Mortgage that was taken out on this home.
Original Mortgage
$5,883
Interest Rate
3%
Mortgage Type
Land Contract Argmt. Of Sale
Purchase Details
Closed on
Jun 9, 2019
Sold by
Barnett Stanley R and Barnett Lois I
Bought by
Arnett Anthony W and Arnett Bonnie
Home Financials for this Owner
Home Financials are based on the most recent Mortgage that was taken out on this home.
Original Mortgage
$51,892
Outstanding Balance
$45,921
Interest Rate
3.9%
Mortgage Type
FHA
Estimated Equity
$118,601
Purchase Details
Closed on
Oct 1, 1995
Create a Home Valuation Report for This Property
The Home Valuation Report is an in-depth analysis detailing your home's value as well as a comparison with similar homes in the area
Home Values in the Area
Average Home Value in this Area
Purchase History
| Date | Buyer | Sale Price | Title Company |
|---|---|---|---|
| Sanucci Anthony J | -- | None Available | |
| Arnett Anthony W | $60,000 | Nations Title Of Okc | |
| -- | $44,000 | -- |
Source: Public Records
Mortgage History
| Date | Status | Borrower | Loan Amount |
|---|---|---|---|
| Open | Arnett Anthony W | $9,442 | |
| Closed | Sanucci Anthony J | $5,883 | |
| Open | Arnett Anthony W | $51,892 | |
| Previous Owner | Barnett Stanley R | $53,458 |
Source: Public Records
Tax History Compared to Growth
Tax History
| Year | Tax Paid | Tax Assessment Tax Assessment Total Assessment is a certain percentage of the fair market value that is determined by local assessors to be the total taxable value of land and additions on the property. | Land | Improvement |
|---|---|---|---|---|
| 2024 | $1,385 | $11,460 | $3,629 | $7,831 |
| 2023 | $1,385 | $10,915 | $3,318 | $7,597 |
| 2022 | $1,386 | $10,395 | $4,824 | $5,571 |
| 2021 | $1,307 | $9,900 | $4,595 | $5,305 |
| 2020 | $1,290 | $9,900 | $4,595 | $5,305 |
| 2019 | $1,658 | $12,099 | $4,595 | $7,504 |
| 2018 | $1,614 | $11,752 | $4,463 | $7,289 |
| 2017 | $1,534 | $11,192 | $4,250 | $6,942 |
| 2016 | $1,503 | $11,192 | $4,250 | $6,942 |
| 2015 | $1,446 | $10,753 | $4,250 | $6,503 |
| 2014 | $1,433 | $10,753 | $4,250 | $6,503 |
Source: Public Records
Map
Nearby Homes
- 4641 S Trenton Ave
- 4641 S Troost Ave
- 4368 S Rockford Place
- 4646 S Victor Ave
- 4349 S Rockford Place
- 4361 S St Louis Ave
- 1313 E 48th St Unit 14
- 1313 E 48th St Unit 4
- 4347 S Saint Louis Ave
- 1421 E 50th St
- 1436 E 50th St
- 1416 E 50th St
- 4517 S Peoria Ave Unit 31
- 5003 S Quaker Ave
- 4823 S Zunis
- 1141 E 49th Place
- 1367 E 43rd St
- 4813 S Norfolk Ave
- 1445 E 52nd St
- 4604 N Troost Ave