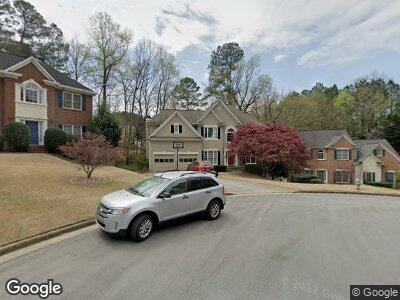
465 Summer Breeze Ct Unit 4 Alpharetta, GA 30005
Estimated Value: $643,000 - $706,000
4
Beds
4
Baths
2,448
Sq Ft
$277/Sq Ft
Est. Value
About This Home
This home is located at 465 Summer Breeze Ct Unit 4, Alpharetta, GA 30005 and is currently estimated at $677,068, approximately $276 per square foot. 465 Summer Breeze Ct Unit 4 is a home located in Fulton County with nearby schools including New Prospect Elementary School, Webb Bridge Middle School, and Alpharetta High School.
Ownership History
Date
Name
Owned For
Owner Type
Purchase Details
Closed on
Oct 12, 2001
Sold by
Boyle Don P and Boyle Sara C
Bought by
Boyle Donald P and Boyle Sara C
Current Estimated Value
Home Financials for this Owner
Home Financials are based on the most recent Mortgage that was taken out on this home.
Original Mortgage
$237,200
Interest Rate
6.54%
Mortgage Type
New Conventional
Purchase Details
Closed on
Aug 28, 1997
Sold by
Ender Richard M and Ender Susan
Bought by
Boyle Don P and Boyle Sara C
Home Financials for this Owner
Home Financials are based on the most recent Mortgage that was taken out on this home.
Original Mortgage
$221,201
Interest Rate
7.5%
Mortgage Type
New Conventional
Purchase Details
Closed on
Apr 26, 1996
Sold by
Peachtreedential Props Inc
Bought by
Ender Richard M Susan M
Create a Home Valuation Report for This Property
The Home Valuation Report is an in-depth analysis detailing your home's value as well as a comparison with similar homes in the area
Home Values in the Area
Average Home Value in this Area
Purchase History
| Date | Buyer | Sale Price | Title Company |
|---|---|---|---|
| Boyle Donald P | -- | -- | |
| Boyle Don P | $221,200 | -- | |
| Ender Richard M Susan M | $203,800 | -- |
Source: Public Records
Mortgage History
| Date | Status | Borrower | Loan Amount |
|---|---|---|---|
| Open | Boyle Donald P | $272,000 | |
| Closed | Boyle Donald P | $75,000 | |
| Closed | Boyle Donald P | $197,001 | |
| Closed | Boyle Donald P | $30,000 | |
| Closed | Boyle Donald P | $20,000 | |
| Closed | Boyle Donald P | $229,800 | |
| Closed | Boyle Donald P | $237,200 | |
| Previous Owner | Boyle Donald P | $30,000 | |
| Previous Owner | Boyle Donald P | $204,650 | |
| Previous Owner | Boyle Don P | $221,201 | |
| Closed | Ender Richard M Susan M | $0 |
Source: Public Records
Tax History Compared to Growth
Tax History
| Year | Tax Paid | Tax Assessment Tax Assessment Total Assessment is a certain percentage of the fair market value that is determined by local assessors to be the total taxable value of land and additions on the property. | Land | Improvement |
|---|---|---|---|---|
| 2023 | $7,596 | $269,120 | $49,040 | $220,080 |
| 2022 | $3,835 | $229,360 | $39,920 | $189,440 |
| 2021 | $4,509 | $174,960 | $30,440 | $144,520 |
| 2020 | $4,531 | $172,880 | $30,080 | $142,800 |
| 2019 | $710 | $179,840 | $27,320 | $152,520 |
| 2018 | $4,198 | $175,640 | $26,680 | $148,960 |
| 2017 | $3,772 | $146,400 | $26,760 | $119,640 |
| 2016 | $3,753 | $146,400 | $26,760 | $119,640 |
| 2015 | $4,408 | $146,400 | $26,760 | $119,640 |
| 2014 | $3,318 | $121,000 | $22,480 | $98,520 |
Source: Public Records
Map
Nearby Homes
- 2280 Whitestone Place
- 2075 Whitestone Place
- 3075 Camden Way
- 5065 Avalon Dr
- 3015 Camden Way
- 3065 Camden Way
- 5002 Avalon Dr
- 220 Autumn Sage Dr Unit 1
- 150 Park Creek Dr
- 625 Park Creek Trace
- 325 N Saint Phillip Ln
- 741 Bentwood Trace
- 785 Westwind Ln
- 870 Longstone Landing
- 3711 Spinnaker Cir
- 4440 Webb Bridge Rd
- 6360 Spinnaker Ln
- 320 Dodd Ln
- 3602 Cape York Trace