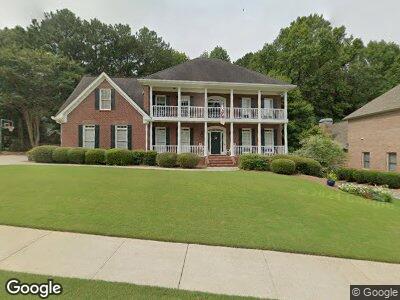
4650 Park Brooke Trace Alpharetta, GA 30022
Estimated Value: $929,602 - $1,112,000
5
Beds
4
Baths
3,447
Sq Ft
$303/Sq Ft
Est. Value
About This Home
This home is located at 4650 Park Brooke Trace, Alpharetta, GA 30022 and is currently estimated at $1,044,401, approximately $302 per square foot. 4650 Park Brooke Trace is a home located in Fulton County with nearby schools including Ocee Elementary School, Webb Bridge Middle School, and Alpharetta High School.
Ownership History
Date
Name
Owned For
Owner Type
Purchase Details
Closed on
Jun 28, 2007
Sold by
Twait Jeffrey R and Twait Elizabeth M
Bought by
Cobb David R and Cobb Angela T
Current Estimated Value
Home Financials for this Owner
Home Financials are based on the most recent Mortgage that was taken out on this home.
Original Mortgage
$446,400
Interest Rate
6.16%
Mortgage Type
New Conventional
Purchase Details
Closed on
Jun 27, 1997
Sold by
Lewis Newman Inc
Bought by
Twait Jeffrey R and Twait Elizabeth
Home Financials for this Owner
Home Financials are based on the most recent Mortgage that was taken out on this home.
Original Mortgage
$278,000
Interest Rate
7.5%
Mortgage Type
New Conventional
Create a Home Valuation Report for This Property
The Home Valuation Report is an in-depth analysis detailing your home's value as well as a comparison with similar homes in the area
Home Values in the Area
Average Home Value in this Area
Purchase History
| Date | Buyer | Sale Price | Title Company |
|---|---|---|---|
| Cobb David R | $558,000 | -- | |
| Twait Jeffrey R | $309,800 | -- |
Source: Public Records
Mortgage History
| Date | Status | Borrower | Loan Amount |
|---|---|---|---|
| Open | Cobb David R | $414,600 | |
| Closed | Cobb Angela T | $30,000 | |
| Closed | Cobb David R | $424,100 | |
| Closed | Cobb David R | $20,000 | |
| Closed | Cobb David R | $50,000 | |
| Closed | Cobb David R | $446,400 | |
| Previous Owner | Twait Jeffrey R | $273,500 | |
| Previous Owner | Twait Jeffrey R | $270,000 | |
| Previous Owner | Twait Jeffrey R | $266,000 | |
| Previous Owner | Twait Jeffrey R | $278,000 |
Source: Public Records
Tax History Compared to Growth
Tax History
| Year | Tax Paid | Tax Assessment Tax Assessment Total Assessment is a certain percentage of the fair market value that is determined by local assessors to be the total taxable value of land and additions on the property. | Land | Improvement |
|---|---|---|---|---|
| 2023 | $8,408 | $297,880 | $75,120 | $222,760 |
| 2022 | $5,293 | $243,600 | $60,120 | $183,480 |
| 2021 | $6,157 | $223,600 | $57,480 | $166,120 |
| 2020 | $6,203 | $220,920 | $56,800 | $164,120 |
| 2019 | $918 | $217,000 | $55,760 | $161,240 |
| 2018 | $5,640 | $211,920 | $54,480 | $157,440 |
| 2017 | $4,941 | $181,280 | $46,000 | $135,280 |
| 2016 | $4,940 | $181,280 | $46,000 | $135,280 |
| 2015 | $5,802 | $181,280 | $46,000 | $135,280 |
| 2014 | $5,166 | $181,280 | $46,000 | $135,280 |
Source: Public Records
Map
Nearby Homes
- 833 Forest Path Ln
- 832 Forest Path Ln
- 426 Vera Park Place
- 625 Park Creek Trace
- 4180 Pineset Dr
- 150 Park Creek Dr
- 115 Braided Blanket Bluff
- 134 Wards Crossing Way Unit 17
- 10925 Pinehigh Dr
- 10945 Pinehigh Dr
- 160 Brookhollow Trace
- 220 Autumn Sage Dr Unit 1
- 11085 State Bridge Rd
- 5002 Avalon Dr
- 3065 Camden Way
- 3015 Camden Way
- 340 Kincardine Way
- 325 N Saint Phillip Ln
- 5065 Avalon Dr
- 3075 Camden Way