Estimated Value: $1,182,000 - $1,479,000
5
Beds
3
Baths
2,685
Sq Ft
$502/Sq Ft
Est. Value
About This Home
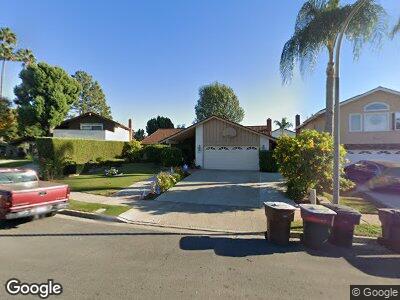
This home is located at 469 Dover Cir, Brea, CA 92821 and is currently estimated at $1,347,409, approximately $501 per square foot. 469 Dover Cir is a home located in Orange County with nearby schools including Brea Country Hills Elementary School, Brea Junior High School, and Brea-Olinda High School.
Ownership History
Date
Name
Owned For
Owner Type
Purchase Details
Closed on
Mar 27, 2000
Sold by
Kilpatrick Richard F and Kilpatrick Susan P
Bought by
Kilpatrick Richard F and Kilpatrick Susan P
Current Estimated Value
Home Financials for this Owner
Home Financials are based on the most recent Mortgage that was taken out on this home.
Original Mortgage
$50,000
Interest Rate
6.99%
Mortgage Type
Credit Line Revolving
Purchase Details
Closed on
Nov 26, 1997
Sold by
Kilpatrick Richard F and Kilpatrick Susan P
Bought by
Kilpatrick Richard F and Kilpatrick Susan P
Home Financials for this Owner
Home Financials are based on the most recent Mortgage that was taken out on this home.
Original Mortgage
$25,000
Interest Rate
7.31%
Mortgage Type
Credit Line Revolving
Purchase Details
Closed on
Feb 10, 1997
Sold by
Kilpatrick Richard F and Kilpatrick Susan P
Bought by
Kilpatrick Richard F and Kilpatrick Susan P
Create a Home Valuation Report for This Property
The Home Valuation Report is an in-depth analysis detailing your home's value as well as a comparison with similar homes in the area
Home Values in the Area
Average Home Value in this Area
Purchase History
| Date | Buyer | Sale Price | Title Company |
|---|---|---|---|
| Kilpatrick Richard F | -- | Southland Title Corporation | |
| Kilpatrick Richard F | -- | -- | |
| Kilpatrick Richard F | -- | -- |
Source: Public Records
Mortgage History
| Date | Status | Borrower | Loan Amount |
|---|---|---|---|
| Closed | Richard F & Susan P Kilpatrick Revocable | $130,600 | |
| Closed | Kilpatrick Richard F | $111,000 | |
| Closed | Kilpatrick Richard | $50,000 | |
| Closed | Kilpatrick Richard | $113,400 | |
| Closed | Kilpatrick Richard F | $50,000 | |
| Closed | Kilpatrick Richard F | $25,000 | |
| Closed | Kilpatrick Richard F | $122,300 |
Source: Public Records
Tax History Compared to Growth
Tax History
| Year | Tax Paid | Tax Assessment Tax Assessment Total Assessment is a certain percentage of the fair market value that is determined by local assessors to be the total taxable value of land and additions on the property. | Land | Improvement |
|---|---|---|---|---|
| 2024 | $3,319 | $274,097 | $108,539 | $165,558 |
| 2023 | $3,225 | $268,723 | $106,411 | $162,312 |
| 2022 | $3,189 | $263,454 | $104,324 | $159,130 |
| 2021 | $3,129 | $258,289 | $102,279 | $156,010 |
| 2020 | $3,107 | $255,641 | $101,230 | $154,411 |
| 2019 | $3,028 | $250,629 | $99,245 | $151,384 |
| 2018 | $2,982 | $245,715 | $97,299 | $148,416 |
| 2017 | $2,925 | $240,898 | $95,392 | $145,506 |
| 2016 | $2,867 | $236,175 | $93,522 | $142,653 |
| 2015 | $2,826 | $232,628 | $92,117 | $140,511 |
| 2014 | $2,745 | $228,072 | $90,313 | $137,759 |
Source: Public Records
Map
Nearby Homes
- 474 Dover Cir
- 431 Devonshire Dr
- 369 Hillhaven Cir
- 2941 Gingerwood Cir
- 2873 Longspur Dr
- 2833 Longspur Dr
- 2365 Raintree Dr
- 2802 Loganberry Ct
- 3007 Clearwood Ct
- 2505 Branch Ln
- 2641 Medford Place
- 3062 Associated Rd Unit 14
- 3010 Associated Rd Unit 122
- 3000 Associated Rd Unit 53
- 2768 Pine Creek Cir
- 2747 Pine Creek Cir
- 301 Blueridge Dr
- 2257 Shadetree Cir
- 2479 Salem Place
- 860 Avocado St