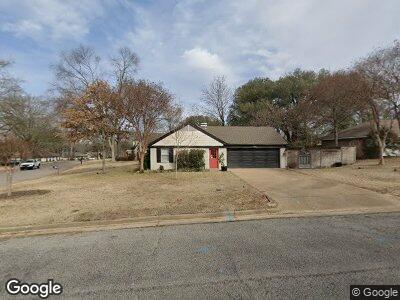
4714 4714 Inverness Dr Tyler, TX 75703
The Highlands NeighborhoodEstimated Value: $305,000 - $333,000
--
Bed
3
Baths
2,195
Sq Ft
$145/Sq Ft
Est. Value
About This Home
This home is located at 4714 4714 Inverness Dr, Tyler, TX 75703 and is currently estimated at $318,639, approximately $145 per square foot. 4714 4714 Inverness Dr is a home located in Smith County with nearby schools including Clarkston Elementary School, Hubbard Middle School, and Tyler Legacy High School.
Ownership History
Date
Name
Owned For
Owner Type
Purchase Details
Closed on
Feb 27, 2012
Sold by
Sweat Dewey Craig and Sweat Katherine Ann
Bought by
Sturrock Michael J and Sturrock Michelle F
Current Estimated Value
Home Financials for this Owner
Home Financials are based on the most recent Mortgage that was taken out on this home.
Original Mortgage
$179,335
Outstanding Balance
$129,698
Interest Rate
4.25%
Mortgage Type
FHA
Estimated Equity
$202,151
Purchase Details
Closed on
Oct 12, 2006
Sold by
Randolph Michael
Bought by
Sweat Dewy Craig
Home Financials for this Owner
Home Financials are based on the most recent Mortgage that was taken out on this home.
Original Mortgage
$148,800
Interest Rate
6.19%
Mortgage Type
Purchase Money Mortgage
Purchase Details
Closed on
May 8, 2006
Sold by
Landes John A and Landes Jamie A
Bought by
Randolph Michael
Home Financials for this Owner
Home Financials are based on the most recent Mortgage that was taken out on this home.
Original Mortgage
$100,000
Interest Rate
6.36%
Mortgage Type
New Conventional
Create a Home Valuation Report for This Property
The Home Valuation Report is an in-depth analysis detailing your home's value as well as a comparison with similar homes in the area
Home Values in the Area
Average Home Value in this Area
Purchase History
| Date | Buyer | Sale Price | Title Company |
|---|---|---|---|
| Sturrock Michael J | -- | None Available | |
| Sweat Dewy Craig | -- | None Available | |
| Randolph Michael | -- | None Available |
Source: Public Records
Mortgage History
| Date | Status | Borrower | Loan Amount |
|---|---|---|---|
| Open | Sturrock Michael J | $12,068 | |
| Open | Sturrock Michael J | $179,335 | |
| Previous Owner | Sweat Dewy Craig | $148,800 | |
| Previous Owner | Randolph Michael | $100,000 |
Source: Public Records
Tax History Compared to Growth
Tax History
| Year | Tax Paid | Tax Assessment Tax Assessment Total Assessment is a certain percentage of the fair market value that is determined by local assessors to be the total taxable value of land and additions on the property. | Land | Improvement |
|---|---|---|---|---|
| 2024 | $4,401 | $311,969 | $34,948 | $277,660 |
| 2023 | $4,944 | $340,415 | $34,948 | $305,467 |
| 2022 | $5,051 | $257,825 | $31,553 | $226,272 |
| 2021 | $5,013 | $238,959 | $31,553 | $207,406 |
| 2020 | $4,772 | $230,316 | $31,553 | $198,763 |
| 2019 | $4,433 | $202,725 | $19,970 | $182,755 |
| 2018 | $4,370 | $200,935 | $19,970 | $180,965 |
| 2017 | $4,290 | $200,935 | $19,970 | $180,965 |
| 2016 | $4,233 | $198,297 | $19,970 | $178,327 |
| 2015 | $3,639 | $190,931 | $19,970 | $170,961 |
| 2014 | $3,639 | $182,865 | $19,970 | $162,895 |
Source: Public Records
Map
Nearby Homes
- 2110 Macbeth Ct
- 4817 Kirkcaldey Dr
- 4909 Kirkcaldey Dr
- 2043 Shiloh Rd
- 4302 Edinburgh Dr
- 2221 Tweed Ct
- 2406 Villa Ct
- 2501 Villa Ct
- 2404 Villa Ct
- 2011 Villa Dr
- 5034 Shiloh Ridge Dr
- 5032 Shiloh Village Dr
- 1813 Sequoia Dr
- 1827 Easy St
- 5058 Shiloh Ridge Dr
- 1705 Devonshire Dr
- 5106 Shiloh Ridge Dr
- 5124 Shiloh Ridge Dr
- 1826 Sybil Ln
- 5139 Shiloh Village Dr