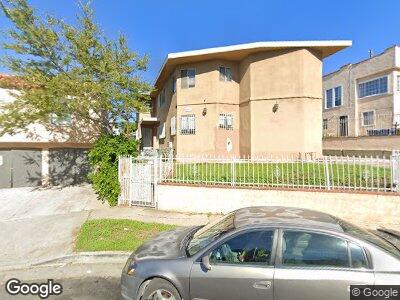
4727 St Elmo Dr Unit 3 Los Angeles, CA 90019
Mid-City NeighborhoodEstimated Value: $1,065,000 - $1,414,000
--
Bed
--
Bath
2,778
Sq Ft
$428/Sq Ft
Est. Value
About This Home
This home is located at 4727 St Elmo Dr Unit 3, Los Angeles, CA 90019 and is currently estimated at $1,188,333, approximately $427 per square foot. 4727 St Elmo Dr Unit 3 is a home located in Los Angeles County with nearby schools including Alta Loma Elementary, Johnnie L. Cochran Jr. Middle School, and Los Angeles Senior High School.
Ownership History
Date
Name
Owned For
Owner Type
Purchase Details
Closed on
Oct 15, 2000
Sold by
Garcia Rudine V
Bought by
Garcia Rudine and The Rudine V Garcia Trust
Current Estimated Value
Purchase Details
Closed on
Jul 7, 2000
Sold by
Wilbert Walton Trust and Rudine V
Bought by
Garcia Rudine
Home Financials for this Owner
Home Financials are based on the most recent Mortgage that was taken out on this home.
Original Mortgage
$208,000
Interest Rate
7.37%
Purchase Details
Closed on
Nov 6, 1997
Sold by
Walton Wilbert
Bought by
Walton Wilbert and The Wilbert Walton Trust
Purchase Details
Closed on
Oct 29, 1996
Sold by
Walton Ceola
Bought by
Walton Wilbert
Home Financials for this Owner
Home Financials are based on the most recent Mortgage that was taken out on this home.
Original Mortgage
$119,000
Interest Rate
8.11%
Create a Home Valuation Report for This Property
The Home Valuation Report is an in-depth analysis detailing your home's value as well as a comparison with similar homes in the area
Home Values in the Area
Average Home Value in this Area
Purchase History
| Date | Buyer | Sale Price | Title Company |
|---|---|---|---|
| Garcia Rudine | -- | -- | |
| Garcia Rudine | $260,000 | Stewart Title | |
| Walton Wilbert | -- | -- | |
| Walton Wilbert | $85,000 | -- |
Source: Public Records
Mortgage History
| Date | Status | Borrower | Loan Amount |
|---|---|---|---|
| Open | Garcia Rudine | $192,500 | |
| Closed | Garcia Rudine | $210,300 | |
| Closed | Garcia Rudine | $208,000 | |
| Closed | Walton Wilbert | $119,000 |
Source: Public Records
Tax History Compared to Growth
Tax History
| Year | Tax Paid | Tax Assessment Tax Assessment Total Assessment is a certain percentage of the fair market value that is determined by local assessors to be the total taxable value of land and additions on the property. | Land | Improvement |
|---|---|---|---|---|
| 2024 | $4,986 | $384,074 | $251,130 | $132,944 |
| 2023 | $4,898 | $376,544 | $246,206 | $130,338 |
| 2022 | $4,685 | $369,162 | $241,379 | $127,783 |
| 2021 | $4,611 | $361,925 | $236,647 | $125,278 |
| 2019 | $4,478 | $351,192 | $229,629 | $121,563 |
| 2018 | $4,388 | $344,307 | $225,127 | $119,180 |
| 2016 | $4,174 | $330,939 | $216,386 | $114,553 |
| 2015 | $4,115 | $325,969 | $213,136 | $112,833 |
| 2014 | $4,154 | $319,584 | $208,961 | $110,623 |
Source: Public Records
Map
Nearby Homes
- 4725 St Elmo Dr
- 1740 S Rimpau Blvd
- 4711 St Elmo Dr
- 4712 W 17th St
- 4616 St Elmo Dr
- 1650 S Rimpau Blvd
- 1733 S Longwood Ave
- 4835 Pickford St
- 4817 Saint Charles Place
- 4601 Pickford St
- 1801 S Longwood Ave
- 1638 S Longwood Ave
- 1626 S Rimpau Blvd
- 1805 S Longwood Ave
- 4567 Pickford St
- 4526 St Elmo Dr
- 4521 Saturn St
- 1731 West Blvd
- 4516 St Charles Place
- 4505 W 18th St