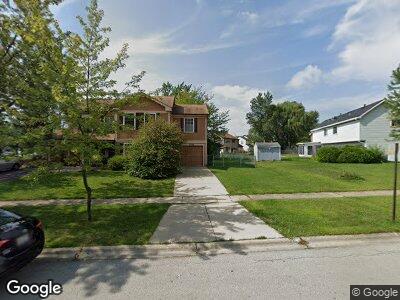
4754 Whitney Dr Hanover Park, IL 60133
South Tri Village NeighborhoodEstimated Value: $243,301 - $277,000
3
Beds
2
Baths
1,136
Sq Ft
$232/Sq Ft
Est. Value
About This Home
This home is located at 4754 Whitney Dr, Hanover Park, IL 60133 and is currently estimated at $263,575, approximately $232 per square foot. 4754 Whitney Dr is a home located in DuPage County with nearby schools including Elsie C. Johnson Elementary School, Stratford Middle School, and Glenbard North High School.
Ownership History
Date
Name
Owned For
Owner Type
Purchase Details
Closed on
Jun 10, 2009
Sold by
Hofer Charles J
Bought by
Baxi Bipin
Current Estimated Value
Home Financials for this Owner
Home Financials are based on the most recent Mortgage that was taken out on this home.
Original Mortgage
$120,000
Interest Rate
4.94%
Mortgage Type
Purchase Money Mortgage
Purchase Details
Closed on
Jan 27, 2006
Sold by
Hofer Terry A
Bought by
Hofer Charles J
Home Financials for this Owner
Home Financials are based on the most recent Mortgage that was taken out on this home.
Original Mortgage
$15,000
Interest Rate
6.37%
Mortgage Type
Credit Line Revolving
Create a Home Valuation Report for This Property
The Home Valuation Report is an in-depth analysis detailing your home's value as well as a comparison with similar homes in the area
Home Values in the Area
Average Home Value in this Area
Purchase History
| Date | Buyer | Sale Price | Title Company |
|---|---|---|---|
| Baxi Bipin | $150,000 | Pntn | |
| Hofer Charles J | -- | None Available |
Source: Public Records
Mortgage History
| Date | Status | Borrower | Loan Amount |
|---|---|---|---|
| Open | Baxi Bipin | $113,500 | |
| Closed | Baxi Bipin | $120,000 | |
| Previous Owner | Hofer Charles J | $100,000 | |
| Previous Owner | Hofer Charles J | $15,000 | |
| Previous Owner | Hofer Charles J | $52,245 | |
| Previous Owner | Hofer Charles | $5,000 | |
| Previous Owner | Hofer Charles | $61,650 |
Source: Public Records
Tax History Compared to Growth
Tax History
| Year | Tax Paid | Tax Assessment Tax Assessment Total Assessment is a certain percentage of the fair market value that is determined by local assessors to be the total taxable value of land and additions on the property. | Land | Improvement |
|---|---|---|---|---|
| 2023 | $1,839 | $64,700 | $13,550 | $51,150 |
| 2022 | $2,423 | $57,820 | $12,110 | $45,710 |
| 2021 | $2,462 | $54,890 | $11,500 | $43,390 |
| 2020 | $2,491 | $53,240 | $11,150 | $42,090 |
| 2019 | $2,500 | $51,340 | $10,750 | $40,590 |
| 2018 | $2,605 | $44,660 | $9,350 | $35,310 |
| 2017 | $2,698 | $39,700 | $8,310 | $31,390 |
| 2016 | $2,797 | $35,110 | $7,350 | $27,760 |
| 2015 | $2,537 | $31,360 | $6,570 | $24,790 |
| 2014 | $2,828 | $28,830 | $6,040 | $22,790 |
| 2013 | $2,811 | $29,520 | $6,180 | $23,340 |
Source: Public Records
Map
Nearby Homes
- 2030 Green Bridge Ln
- 1743 Fulton Ln
- 1900 Wildwood Ln
- 5256 Ladd Ln
- 1639 Colfax Ct Unit 2
- 158 Goldeneye Ln
- 1947 Lucille Ln
- 1368 Newcastle Ln Unit 6
- 538 Mandarin Ln
- 3945 Port Dr
- 1208 Arlington Dr E
- 1575 Schooner Ln
- 1332 Sea Biscuit Ln
- 1519 Turner Ln
- 1520 Spinnaker Ln
- 1396 Newcastle Ct
- 1402 Beaumont Cir
- 410 Harvard Ln
- 2240 Greenbay Dr
- 4050 Bayside Dr