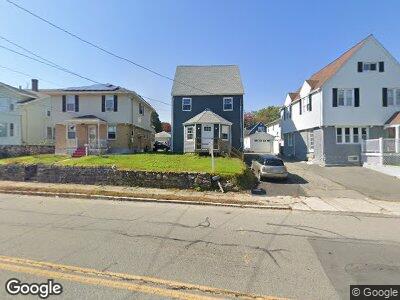
48 Milk St Methuen, MA 01844
The East End NeighborhoodEstimated Value: $489,763 - $600,000
3
Beds
2
Baths
1,708
Sq Ft
$317/Sq Ft
Est. Value
About This Home
This home is located at 48 Milk St, Methuen, MA 01844 and is currently estimated at $541,191, approximately $316 per square foot. 48 Milk St is a home located in Essex County with nearby schools including Timony Grammar School and Methuen High School.
Ownership History
Date
Name
Owned For
Owner Type
Purchase Details
Closed on
Jul 24, 2018
Sold by
Keenan Patricia L Est and Hyatt
Bought by
Mastrangelo Mark and Hart Randall F
Current Estimated Value
Home Financials for this Owner
Home Financials are based on the most recent Mortgage that was taken out on this home.
Original Mortgage
$150,000
Interest Rate
4.5%
Mortgage Type
Commercial
Create a Home Valuation Report for This Property
The Home Valuation Report is an in-depth analysis detailing your home's value as well as a comparison with similar homes in the area
Home Values in the Area
Average Home Value in this Area
Purchase History
| Date | Buyer | Sale Price | Title Company |
|---|---|---|---|
| Mastrangelo Mark | $150,000 | -- | |
| Mastrangelo Mark | $150,000 | -- |
Source: Public Records
Mortgage History
| Date | Status | Borrower | Loan Amount |
|---|---|---|---|
| Open | Hart Randall F | $450,000 | |
| Closed | Mastrangelo Mark | $150,000 | |
| Previous Owner | Keenan Patricia L | $150,000 | |
| Previous Owner | Keenan Patricia L | $50,000 |
Source: Public Records
Tax History Compared to Growth
Tax History
| Year | Tax Paid | Tax Assessment Tax Assessment Total Assessment is a certain percentage of the fair market value that is determined by local assessors to be the total taxable value of land and additions on the property. | Land | Improvement |
|---|---|---|---|---|
| 2025 | $4,402 | $416,100 | $189,900 | $226,200 |
| 2024 | $4,337 | $399,400 | $173,200 | $226,200 |
| 2023 | $4,101 | $350,500 | $154,000 | $196,500 |
| 2022 | $3,941 | $302,000 | $128,300 | $173,700 |
| 2021 | $3,720 | $282,000 | $121,900 | $160,100 |
| 2020 | $3,699 | $275,200 | $121,900 | $153,300 |
| 2019 | $3,374 | $237,800 | $105,800 | $132,000 |
| 2018 | $3,298 | $231,100 | $105,800 | $125,300 |
| 2017 | $3,186 | $217,500 | $105,800 | $111,700 |
| 2016 | $3,129 | $211,300 | $99,600 | $111,700 |
| 2015 | $2,968 | $203,300 | $99,600 | $103,700 |
Source: Public Records
Map
Nearby Homes
- 4 Breen Ave
- 50-52 Adelaide Ave
- 38 Magna Rd
- 40-42 Cornish St
- 11 Delmont St
- 59 Kendall St
- 34 Ridge Rd
- 80 Swan Ave
- 25 Eastbrook Place
- 687 Jackson St
- 29 Oak St
- 396 Oak St
- 19 Oakmeadow Ln
- 68 Wesley St
- 90 Larchwood Rd
- 412-414 High St
- 5 Apple Crest Dr
- 87-89 Trenton St
- 274 E Haverhill St Unit 2
- 83 Chippy Ln