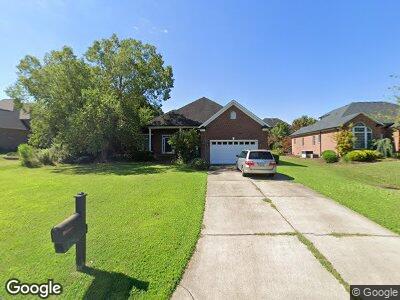
4800 Sherborne Dr Harrisburg, NC 28075
Clare Haven NeighborhoodEstimated Value: $489,000 - $538,000
3
Beds
2
Baths
2,039
Sq Ft
$251/Sq Ft
Est. Value
About This Home
This home is located at 4800 Sherborne Dr, Harrisburg, NC 28075 and is currently estimated at $512,445, approximately $251 per square foot. 4800 Sherborne Dr is a home located in Cabarrus County with nearby schools including Hickory Ridge Elementary School, Hickory Ridge Middle, and Hickory Ridge High School.
Ownership History
Date
Name
Owned For
Owner Type
Purchase Details
Closed on
Jul 29, 2010
Sold by
Cox Shane B and Cox Melissa L
Bought by
Luu Kim A
Current Estimated Value
Home Financials for this Owner
Home Financials are based on the most recent Mortgage that was taken out on this home.
Original Mortgage
$204,000
Outstanding Balance
$140,853
Interest Rate
4.74%
Mortgage Type
New Conventional
Estimated Equity
$376,716
Purchase Details
Closed on
May 14, 2004
Sold by
Lang David G and Lang Patricia
Bought by
Cox Shane B and Cox Melissa L
Home Financials for this Owner
Home Financials are based on the most recent Mortgage that was taken out on this home.
Original Mortgage
$225,050
Interest Rate
5.49%
Mortgage Type
Purchase Money Mortgage
Purchase Details
Closed on
Aug 19, 2002
Sold by
C F Little Construction Inc
Bought by
Lang David G and Lang Patricia
Home Financials for this Owner
Home Financials are based on the most recent Mortgage that was taken out on this home.
Original Mortgage
$60,000
Interest Rate
6.02%
Create a Home Valuation Report for This Property
The Home Valuation Report is an in-depth analysis detailing your home's value as well as a comparison with similar homes in the area
Home Values in the Area
Average Home Value in this Area
Purchase History
| Date | Buyer | Sale Price | Title Company |
|---|---|---|---|
| Luu Kim A | $255,000 | Master Title | |
| Cox Shane B | $237,000 | -- | |
| Lang David G | $225,000 | -- | |
| C F Little Construction Inc | $12,500 | -- |
Source: Public Records
Mortgage History
| Date | Status | Borrower | Loan Amount |
|---|---|---|---|
| Open | Luu Kim A | $26,675 | |
| Open | Luu Kim A | $204,000 | |
| Previous Owner | Cox Shane B | $225,050 | |
| Previous Owner | C F Little Construction Inc | $60,000 |
Source: Public Records
Tax History Compared to Growth
Tax History
| Year | Tax Paid | Tax Assessment Tax Assessment Total Assessment is a certain percentage of the fair market value that is determined by local assessors to be the total taxable value of land and additions on the property. | Land | Improvement |
|---|---|---|---|---|
| 2024 | $4,534 | $459,880 | $100,000 | $359,880 |
| 2023 | $3,309 | $281,630 | $65,000 | $216,630 |
| 2022 | $3,309 | $281,630 | $65,000 | $216,630 |
| 2021 | $3,084 | $281,630 | $65,000 | $216,630 |
| 2020 | $3,084 | $281,630 | $65,000 | $216,630 |
| 2019 | $2,660 | $242,930 | $50,000 | $192,930 |
| 2018 | $2,612 | $242,930 | $50,000 | $192,930 |
| 2017 | $2,405 | $242,930 | $50,000 | $192,930 |
| 2016 | $2,405 | $254,840 | $50,000 | $204,840 |
| 2015 | $1,784 | $254,840 | $50,000 | $204,840 |
| 2014 | $1,784 | $254,840 | $50,000 | $204,840 |
Source: Public Records
Map
Nearby Homes
- 4671 Lucas Ct
- 4836 Pepper Dr
- 4856 Pepper Dr
- 4897 Annelise Dr
- 8985 Rocky River Rd
- 8979 Rocky River Rd
- 8923 Happiness Rd
- 4205 Green Park Ct
- 8941 Vickery Ln
- 8905 Landsdowne Ave
- 7925 Tottenham Dr
- 7530 Baybrooke Ln Unit 77
- 7549 Baybrooke Ln Unit 32
- 8117 Stillhouse Ln Unit 25
- 8117 Stillhouse Ln
- 7555 Baybrooke Ln Unit 33
- 7561 Baybrooke Ln Unit 34
- 8321 Rocky River Rd
- 7567 Baybrooke Ln Unit 35
- 4820 Reason Ct Unit 67