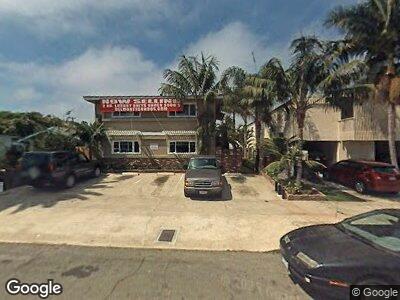
4841 Del Monte Ave Unit B San Diego, CA 92107
Ocean Beach NeighborhoodEstimated Value: $679,000 - $795,000
2
Beds
1
Bath
750
Sq Ft
$1,000/Sq Ft
Est. Value
About This Home
This home is located at 4841 Del Monte Ave Unit B, San Diego, CA 92107 and is currently estimated at $749,976, approximately $999 per square foot. 4841 Del Monte Ave Unit B is a home located in San Diego County with nearby schools including Ocean Beach Elementary School, Richard Henry Dana Middle School, and Correia Middle School.
Ownership History
Date
Name
Owned For
Owner Type
Purchase Details
Closed on
Dec 31, 2020
Sold by
Smith Patricia J
Bought by
Donnenfeld Alexander
Current Estimated Value
Home Financials for this Owner
Home Financials are based on the most recent Mortgage that was taken out on this home.
Original Mortgage
$432,000
Outstanding Balance
$389,262
Interest Rate
2.6%
Mortgage Type
New Conventional
Estimated Equity
$360,714
Purchase Details
Closed on
Oct 16, 2007
Sold by
Its A Beach Llc
Bought by
Smith Patricia J
Home Financials for this Owner
Home Financials are based on the most recent Mortgage that was taken out on this home.
Original Mortgage
$240,000
Interest Rate
6.4%
Mortgage Type
Purchase Money Mortgage
Create a Home Valuation Report for This Property
The Home Valuation Report is an in-depth analysis detailing your home's value as well as a comparison with similar homes in the area
Home Values in the Area
Average Home Value in this Area
Purchase History
| Date | Buyer | Sale Price | Title Company |
|---|---|---|---|
| Donnenfeld Alexander | $540,000 | Fin Title | |
| Smith Patricia J | $385,000 | Chicago Title Co |
Source: Public Records
Mortgage History
| Date | Status | Borrower | Loan Amount |
|---|---|---|---|
| Open | Donnenfeld Alexander | $432,000 | |
| Previous Owner | Smith Patricia J | $227,000 | |
| Previous Owner | Smith Patricia J | $240,000 |
Source: Public Records
Tax History Compared to Growth
Tax History
| Year | Tax Paid | Tax Assessment Tax Assessment Total Assessment is a certain percentage of the fair market value that is determined by local assessors to be the total taxable value of land and additions on the property. | Land | Improvement |
|---|---|---|---|---|
| 2024 | $7,069 | $573,049 | $431,648 | $141,401 |
| 2023 | $6,914 | $561,814 | $423,185 | $138,629 |
| 2022 | $6,730 | $550,799 | $414,888 | $135,911 |
| 2021 | $5,787 | $467,176 | $351,899 | $115,277 |
| 2020 | $5,717 | $462,386 | $348,291 | $114,095 |
| 2019 | $5,615 | $453,320 | $341,462 | $111,858 |
| 2018 | $5,250 | $444,432 | $334,767 | $109,665 |
| 2017 | $4,942 | $420,000 | $315,000 | $105,000 |
| 2016 | $4,725 | $400,000 | $300,000 | $100,000 |
| 2015 | $4,491 | $380,000 | $285,000 | $95,000 |
| 2014 | $4,509 | $380,000 | $285,000 | $95,000 |
Source: Public Records
Map
Nearby Homes
- 4820 Santa Cruz Ave Unit 3
- 4817 Coronado Ave
- 4687 Del Monte Ave
- 4909 Orchard Ave Unit 301
- 4909 Orchard Ave Unit 101
- 4605 Santa Cruz Ave
- 1759 Ocean Front St
- 4878 Pescadero Ave Unit 103
- 4847-49 Saratoga Ave
- 4569 Coronado Ave
- 1971 Ebers St
- 4783 Bermuda Ave
- 5015 Cape May Ave Unit 210
- 5015 Cape May Ave Unit 307
- 5015 Cape May Ave Unit 203
- 4585-87 Saratoga Ave
- 4603-5 Bermuda Ave
- 4832 Long Branch Ave
- 4844 Long Branch Ave
- 4563 Point Loma Ave