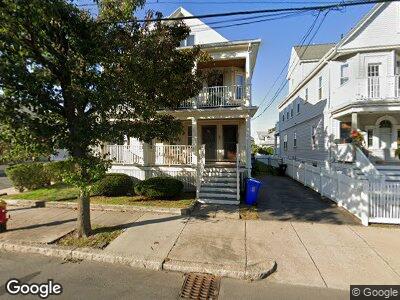
487 Medford St Unit 489 Malden, MA 02148
Edgeworth NeighborhoodEstimated Value: $995,000 - $1,163,365
6
Beds
3
Baths
3,646
Sq Ft
$299/Sq Ft
Est. Value
About This Home
This home is located at 487 Medford St Unit 489, Malden, MA 02148 and is currently estimated at $1,091,091, approximately $299 per square foot. 487 Medford St Unit 489 is a home located in Middlesex County with nearby schools including Malden High School and Mystic Valley Regional Charter School.
Ownership History
Date
Name
Owned For
Owner Type
Purchase Details
Closed on
Mar 29, 2021
Sold by
Lee Pak and Lee Mimi
Bought by
Pak Sam Lee & Mimi Lee Lt
Current Estimated Value
Purchase Details
Closed on
Dec 1, 2005
Sold by
Tanner Mark G
Bought by
Lee Barry and Lee John
Home Financials for this Owner
Home Financials are based on the most recent Mortgage that was taken out on this home.
Original Mortgage
$399,000
Interest Rate
6.14%
Mortgage Type
Purchase Money Mortgage
Purchase Details
Closed on
Sep 29, 1994
Sold by
Migliore Angelo A and Baglione Elizabeth
Bought by
Tanner Mark G and Tanner Claire C
Purchase Details
Closed on
Dec 5, 1988
Sold by
Raptis Elias
Bought by
Emt Rt
Create a Home Valuation Report for This Property
The Home Valuation Report is an in-depth analysis detailing your home's value as well as a comparison with similar homes in the area
Home Values in the Area
Average Home Value in this Area
Purchase History
| Date | Buyer | Sale Price | Title Company |
|---|---|---|---|
| Pak Sam Lee & Mimi Lee Lt | -- | None Available | |
| Lee Barry | $599,000 | -- | |
| Tanner Mark G | $150,000 | -- | |
| Tanner Mark G | $150,000 | -- | |
| Emt Rt | $210,000 | -- |
Source: Public Records
Mortgage History
| Date | Status | Borrower | Loan Amount |
|---|---|---|---|
| Previous Owner | Lee Barry | $399,000 | |
| Previous Owner | Tanner Mark G | $281,500 | |
| Previous Owner | Emt Rt | $277,000 | |
| Previous Owner | Emt Rt | $166,350 | |
| Previous Owner | Emt Rt | $164,000 |
Source: Public Records
Tax History Compared to Growth
Tax History
| Year | Tax Paid | Tax Assessment Tax Assessment Total Assessment is a certain percentage of the fair market value that is determined by local assessors to be the total taxable value of land and additions on the property. | Land | Improvement |
|---|---|---|---|---|
| 2025 | $111 | $977,600 | $303,400 | $674,200 |
| 2024 | $10,740 | $918,700 | $286,600 | $632,100 |
| 2023 | $10,401 | $853,200 | $261,300 | $591,900 |
| 2022 | $10,000 | $809,700 | $236,000 | $573,700 |
| 2021 | $11,014 | $896,200 | $210,700 | $685,500 |
| 2020 | $10,677 | $844,000 | $203,600 | $640,400 |
| 2019 | $9,923 | $747,800 | $193,900 | $553,900 |
| 2018 | $9,645 | $684,500 | $160,100 | $524,400 |
| 2017 | $9,108 | $642,800 | $153,800 | $489,000 |
| 2016 | $8,390 | $553,400 | $141,200 | $412,200 |
| 2015 | $8,134 | $517,100 | $134,400 | $382,700 |
| 2014 | $7,707 | $478,700 | $122,200 | $356,500 |
Source: Public Records
Map
Nearby Homes
- 150 Oakland St
- 111 Devir St Unit 306
- 140 Malden St
- 244 Central Ave Unit 4
- 51 Kenmere Rd Unit 51
- 25 Wicklow Ave
- 29 Hurlcroft Ave
- 83 Wicklow Ave
- 320 Middlesex Ave Unit B401
- 320 Middlesex Ave Unit C206
- 320 Middlesex Ave Unit A301
- 194 Adams St
- 111-111A Adams St
- 73-75 Gale St
- 31 Sydney St
- 111 4th St
- 95 4th St Unit 1
- 499 Salem St
- 500 Salem St Unit 604
- 500 Salem St Unit 808