
Seller's Agent in 2025
Amber Blake
Stacy Blake Realty LLC
(203) 713-8090
7 in this area
52 Total Sales
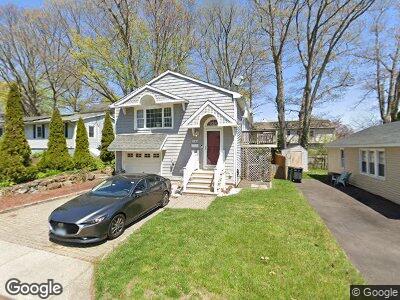
Just in time for Spring! Come enjoy shoreline living in this year-round beach home, featuring 2 beds and 1.5 baths. Resting in Wildermere Beach and conveniently located near Walnut Beach! Entering into the home the bright and cozy kitchen welcomes you featuring granite counters, stainless steel appliances and hardwood flooring. The inviting living room is spacious featuring a living/dining room combination with hardwood flooring throughout. Heading down the hall you'll find a full bath w/tub; and two generous sized bedrooms. The lower level is a versatile living space with half bath and slider leading to the backyard, making it the perfect place to gather and share with family and friends! Just a stroll down the street to Wildermere or Walnut Beach with a boardwalk that stretch's alongside the shoreline with stunning views leading to restaurants, live music, farmers market and more! Close proximity to major highways and the Milford Train Station, a commuter's delight. Bring your kayaks, beach chairs and live the lifestyle you deserve! DON'T MISS OUT, schedule your viewing today!
| Date | Buyer | Sale Price | Title Company |
|---|---|---|---|
| Wyse Jason | $314,000 | -- | |
| Wyse Jason | $314,000 | -- |
| Date | Status | Borrower | Loan Amount |
|---|---|---|---|
| Open | Begg Bruce F | $246,400 | |
| Closed | Begg Bruce F | $246,400 | |
| Previous Owner | Begg Bruce F | $132,000 | |
| Previous Owner | Begg Bruce F | $77,988 |
| Date | Event | Price | Change | Sq Ft Price |
|---|---|---|---|---|
| 03/17/2025 03/17/25 | Rented | $3,000 | 0.0% | -- |
| 02/19/2025 02/19/25 | Under Contract | -- | -- | -- |
| 02/03/2025 02/03/25 | For Rent | $3,000 | 0.0% | -- |
| 03/11/2024 03/11/24 | Rented | $3,000 | 0.0% | -- |
| 03/10/2024 03/10/24 | Under Contract | -- | -- | -- |
| 02/28/2024 02/28/24 | For Rent | $3,000 | 0.0% | -- |
| 04/01/2022 04/01/22 | Sold | $410,000 | +19.2% | $280 / Sq Ft |
| 03/18/2022 03/18/22 | Pending | -- | -- | -- |
| 02/22/2022 02/22/22 | For Sale | $344,000 | -- | $235 / Sq Ft |
| Year | Tax Paid | Tax Assessment Tax Assessment Total Assessment is a certain percentage of the fair market value that is determined by local assessors to be the total taxable value of land and additions on the property. | Land | Improvement |
|---|---|---|---|---|
| 2024 | $7,035 | $241,410 | $114,420 | $126,990 |
| 2023 | $6,559 | $241,410 | $114,420 | $126,990 |
| 2022 | $6,238 | $234,090 | $114,420 | $119,670 |
| 2021 | $4,694 | $169,760 | $58,210 | $111,550 |
| 2020 | $4,699 | $169,760 | $58,210 | $111,550 |
| 2019 | $4,704 | $169,760 | $58,210 | $111,550 |
| 2018 | $4,709 | $169,760 | $58,210 | $111,550 |
| 2017 | $4,718 | $169,760 | $58,210 | $111,550 |
| 2016 | $4,630 | $166,300 | $56,700 | $109,600 |
| 2015 | $4,636 | $166,300 | $56,700 | $109,600 |
| 2014 | $4,527 | $166,300 | $56,700 | $109,600 |
Seller's Agent in 2025
Amber Blake
Stacy Blake Realty LLC
(203) 713-8090
7 in this area
52 Total Sales
Seller's Agent in 2022
Aaron Goldberg
Coldwell Banker Realty
(203) 561-0362
1 in this area
52 Total Sales
Buyer's Agent in 2022
Julie Vanderblue
Higgins Group Real Estate
(475) 471-0636
1 in this area
312 Total Sales