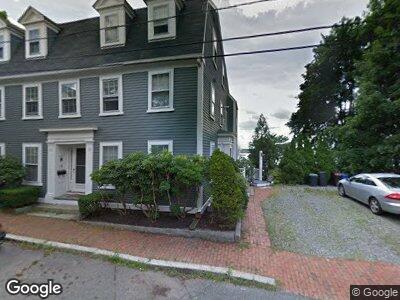
49 Front St Unit 47 Beverly, MA 01915
Downtown Beverly NeighborhoodEstimated Value: $529,785 - $628,000
2
Beds
3
Baths
1,420
Sq Ft
$411/Sq Ft
Est. Value
About This Home
This home is located at 49 Front St Unit 47, Beverly, MA 01915 and is currently estimated at $583,946, approximately $411 per square foot. 49 Front St Unit 47 is a home located in Essex County with nearby schools including Beverly High School, Mrs Alexander's School, and Shore Country Day School.
Create a Home Valuation Report for This Property
The Home Valuation Report is an in-depth analysis detailing your home's value as well as a comparison with similar homes in the area
Home Values in the Area
Average Home Value in this Area
Tax History Compared to Growth
Tax History
| Year | Tax Paid | Tax Assessment Tax Assessment Total Assessment is a certain percentage of the fair market value that is determined by local assessors to be the total taxable value of land and additions on the property. | Land | Improvement |
|---|---|---|---|---|
| 2025 | $5,148 | $468,400 | $0 | $468,400 |
| 2024 | $5,020 | $447,000 | $0 | $447,000 |
| 2023 | $4,681 | $415,700 | $0 | $415,700 |
| 2022 | $4,858 | $399,200 | $0 | $399,200 |
| 2021 | $4,798 | $377,800 | $0 | $377,800 |
| 2020 | $4,729 | $368,600 | $0 | $368,600 |
| 2019 | $4,548 | $344,300 | $0 | $344,300 |
Source: Public Records
Map
Nearby Homes
- 57 Front St Unit 1
- 57 Front St Unit 3
- 12 Cox Ct Unit PHB
- 50 Rantoul St Unit 305
- 60 Rantoul St Unit 514N
- 15 River St
- 20 Atlantic Ave
- 49 Federal St
- 19 Pond St
- 28 Arthur St Unit 1
- 8 Rice St
- 41 Bridge St
- 23 Settlers Way Unit 23
- 6 Lathrop St Unit 2
- 6 Lathrop St Unit 1
- 6 Lathrop St Unit 3
- 71 Livingstone Ave
- 85 Kernwood Ave
- 64 Essex St
- 156 Park St Unit 2