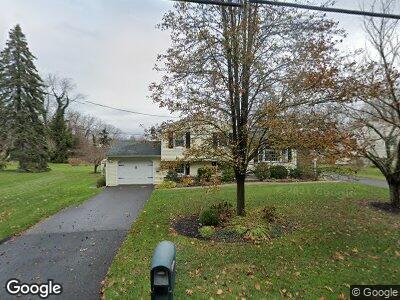
49 Stannard Ave Branford, CT 06405
Branford Center NeighborhoodEstimated Value: $435,393 - $563,000
3
Beds
2
Baths
1,536
Sq Ft
$331/Sq Ft
Est. Value
About This Home
This home is located at 49 Stannard Ave, Branford, CT 06405 and is currently estimated at $508,598, approximately $331 per square foot. 49 Stannard Ave is a home located in New Haven County with nearby schools including Francis Walsh Intermediate School, Branford High School, and St Mary School.
Ownership History
Date
Name
Owned For
Owner Type
Purchase Details
Closed on
May 8, 2007
Sold by
Locarno Alice M
Bought by
Bozzuto Donna L and Josephson Laura L
Current Estimated Value
Home Financials for this Owner
Home Financials are based on the most recent Mortgage that was taken out on this home.
Original Mortgage
$250,000
Outstanding Balance
$157,666
Interest Rate
6.23%
Estimated Equity
$357,764
Create a Home Valuation Report for This Property
The Home Valuation Report is an in-depth analysis detailing your home's value as well as a comparison with similar homes in the area
Home Values in the Area
Average Home Value in this Area
Purchase History
| Date | Buyer | Sale Price | Title Company |
|---|---|---|---|
| Bozzuto Donna L | $375,000 | -- |
Source: Public Records
Mortgage History
| Date | Status | Borrower | Loan Amount |
|---|---|---|---|
| Open | Locarno Louis H | $250,000 | |
| Previous Owner | Locarno Louis H | $45,000 | |
| Previous Owner | Locarno Louis H | $15,000 |
Source: Public Records
Tax History Compared to Growth
Tax History
| Year | Tax Paid | Tax Assessment Tax Assessment Total Assessment is a certain percentage of the fair market value that is determined by local assessors to be the total taxable value of land and additions on the property. | Land | Improvement |
|---|---|---|---|---|
| 2024 | $6,553 | $215,000 | $109,000 | $106,000 |
| 2023 | $6,426 | $215,000 | $109,000 | $106,000 |
| 2022 | $6,332 | $215,000 | $109,000 | $106,000 |
| 2021 | $6,332 | $215,000 | $109,000 | $106,000 |
| 2020 | $6,218 | $215,000 | $109,000 | $106,000 |
| 2019 | $6,587 | $226,600 | $127,700 | $98,900 |
| 2018 | $6,490 | $226,600 | $127,700 | $98,900 |
| 2017 | $6,451 | $226,600 | $127,700 | $98,900 |
| 2016 | $6,211 | $226,600 | $127,700 | $98,900 |
| 2015 | $6,102 | $226,600 | $127,700 | $98,900 |
| 2014 | $6,132 | $233,700 | $127,700 | $106,000 |
Source: Public Records
Map
Nearby Homes
- 4 Castle Rock
- 21 Castle Rock
- 31 Harbour Village Unit A
- 5 Harbour Village Unit B
- 22 Harbour Village Unit A
- 13 Harbour Village Unit D
- 324 Maple St
- 36 Quarry Dock Rd
- 13 Stonegate Unit A
- 17 Reynolds Ln
- 70 Quarry Dock Rd Unit 70
- 60 Maple St Unit 38B
- 39 River Rd
- 65 Goodsell Point Rd Unit 71
- 231 Pawson Rd
- 215 Main St
- 81 Main St Unit 19B
- 21 Orchard Hill Rd
- 509 Plymouth Colony
- 615 Main St Unit 627