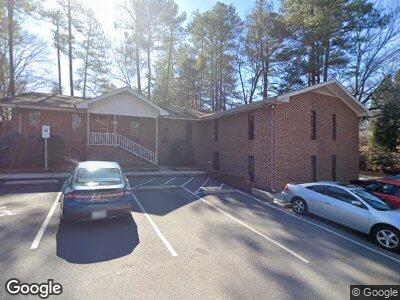
4913 Professional Ct Unit 218, 219, 101, 102 Raleigh, NC 27609
Estimated Value: $1,521,838
--
Bed
--
Bath
4,920
Sq Ft
$309/Sq Ft
Est. Value
About This Home
This home is located at 4913 Professional Ct Unit 218, 219, 101, 102, Raleigh, NC 27609 and is currently estimated at $1,521,838, approximately $309 per square foot. 4913 Professional Ct Unit 218, 219, 101, 102 is a home located in Wake County with nearby schools including Millbrook Elementary School, East Millbrook Middle, and Millbrook High School.
Ownership History
Date
Name
Owned For
Owner Type
Purchase Details
Closed on
Jul 24, 2017
Sold by
Mission Hous Properties Llc
Bought by
Intelleectrual Propertiees Number Ii Llc
Current Estimated Value
Home Financials for this Owner
Home Financials are based on the most recent Mortgage that was taken out on this home.
Original Mortgage
$596,000
Interest Rate
3.89%
Mortgage Type
Construction
Purchase Details
Closed on
Oct 5, 2006
Sold by
Alphin Oliver W and Alphin Eva G
Bought by
Mission House Properties Llc
Home Financials for this Owner
Home Financials are based on the most recent Mortgage that was taken out on this home.
Original Mortgage
$55,000
Interest Rate
6.29%
Mortgage Type
Construction
Purchase Details
Closed on
May 14, 2002
Sold by
Alphin Oliver W and Alphin Billie C
Bought by
Alphin Oliver W and Alphin Billie C
Create a Home Valuation Report for This Property
The Home Valuation Report is an in-depth analysis detailing your home's value as well as a comparison with similar homes in the area
Home Values in the Area
Average Home Value in this Area
Purchase History
| Date | Buyer | Sale Price | Title Company |
|---|---|---|---|
| Intelleectrual Propertiees Number Ii Llc | $745,000 | None Available | |
| Mission House Properties Llc | $475,000 | None Available | |
| Alphin Oliver W | -- | -- |
Source: Public Records
Mortgage History
| Date | Status | Borrower | Loan Amount |
|---|---|---|---|
| Open | Intellectual Properties Number | $1,850,000 | |
| Closed | Intelleectrual Propertiees Number Ii Llc | $596,000 | |
| Previous Owner | Mission House Properties Llc | $463,153 | |
| Previous Owner | Mission House Properties Llc | $50,000 | |
| Previous Owner | Mission House Properties Llc | $55,000 | |
| Previous Owner | Mission House Properties Llc | $441,000 |
Source: Public Records
Tax History Compared to Growth
Tax History
| Year | Tax Paid | Tax Assessment Tax Assessment Total Assessment is a certain percentage of the fair market value that is determined by local assessors to be the total taxable value of land and additions on the property. | Land | Improvement |
|---|---|---|---|---|
| 2024 | $6,208 | $714,769 | $187,556 | $527,213 |
| 2023 | $6,452 | $591,959 | $140,667 | $451,292 |
| 2022 | $5,994 | $591,959 | $140,667 | $451,292 |
| 2021 | $5,760 | $591,959 | $140,667 | $451,292 |
| 2020 | $5,654 | $591,959 | $140,667 | $451,292 |
| 2019 | $4,843 | $417,866 | $140,266 | $277,600 |
| 2018 | $4,566 | $417,866 | $140,266 | $277,600 |
| 2017 | $4,347 | $417,866 | $140,266 | $277,600 |
| 2016 | $4,257 | $417,866 | $140,266 | $277,600 |
| 2015 | $4,235 | $409,003 | $141,666 | $267,337 |
| 2014 | $4,016 | $409,003 | $141,666 | $267,337 |
Source: Public Records
Map
Nearby Homes
- 5816 Pointer Dr Unit 102
- 1700 Tiffany Bay Ct Unit 303
- 1738 Quail Ridge Rd
- 1616 Beechwood Dr
- 4842 Wyatt Brook Way
- 1812 Natalie Brook Way
- 1600 Township Cir
- 1608 Doubles Ct
- 1205 Country Ridge Dr
- 5107 Hearth Dr
- 5347 Cypress Ln
- 5356 Cypress Ln
- 1318 Ivy Ln
- 4601 Pemberton Dr
- 1304 Ivy Ln
- 4600 Old Wake Forest Rd
- 5713 Timber Ridge Dr
- 5205 Quail Meadow Dr
- 5504 Kingwood Dr
- 5718 Sentinel Dr