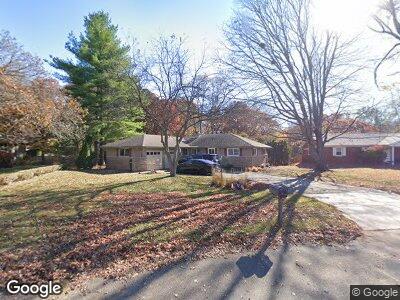
4916 W Jennifer Ln Peoria, IL 61607
Bartonville NeighborhoodEstimated Value: $196,000 - $233,000
4
Beds
3
Baths
1,576
Sq Ft
$139/Sq Ft
Est. Value
About This Home
This home is located at 4916 W Jennifer Ln, Peoria, IL 61607 and is currently estimated at $218,294, approximately $138 per square foot. 4916 W Jennifer Ln is a home located in Peoria County with nearby schools including Monroe Elementary School and Limestone Community High School.
Ownership History
Date
Name
Owned For
Owner Type
Purchase Details
Closed on
Mar 18, 2022
Sold by
Kamin Jr James B
Bought by
Jennifer Kamin and Jennifer Amanda Easley
Current Estimated Value
Home Financials for this Owner
Home Financials are based on the most recent Mortgage that was taken out on this home.
Original Mortgage
$185,000
Outstanding Balance
$174,316
Interest Rate
3.13%
Mortgage Type
VA
Estimated Equity
$43,921
Purchase Details
Closed on
Mar 14, 2022
Sold by
Jennifer Kamin
Bought by
Anske Christopher L and Anske Heather M
Home Financials for this Owner
Home Financials are based on the most recent Mortgage that was taken out on this home.
Original Mortgage
$185,000
Outstanding Balance
$174,316
Interest Rate
3.13%
Mortgage Type
VA
Estimated Equity
$43,921
Purchase Details
Closed on
May 17, 2017
Sold by
Paragon Decision Resources
Bought by
Kamin James B
Home Financials for this Owner
Home Financials are based on the most recent Mortgage that was taken out on this home.
Original Mortgage
$164,900
Interest Rate
4.62%
Mortgage Type
New Conventional
Purchase Details
Closed on
May 27, 2003
Bought by
Wallace Deborah L and Wallace Kevin R
Create a Home Valuation Report for This Property
The Home Valuation Report is an in-depth analysis detailing your home's value as well as a comparison with similar homes in the area
Home Values in the Area
Average Home Value in this Area
Purchase History
| Date | Buyer | Sale Price | Title Company |
|---|---|---|---|
| Anske Christopher L | $185,000 | Cusack Gilfillan Llc | |
| Kamin James B | -- | -- | |
| Wallace Deborah L | $147,500 | -- |
Source: Public Records
Mortgage History
| Date | Status | Borrower | Loan Amount |
|---|---|---|---|
| Open | Anske Christopher L | $185,000 | |
| Previous Owner | Kamin James B | $164,900 |
Source: Public Records
Tax History Compared to Growth
Tax History
| Year | Tax Paid | Tax Assessment Tax Assessment Total Assessment is a certain percentage of the fair market value that is determined by local assessors to be the total taxable value of land and additions on the property. | Land | Improvement |
|---|---|---|---|---|
| 2023 | $4,899 | $63,410 | $9,980 | $53,430 |
| 2022 | $5,393 | $60,010 | $9,420 | $50,590 |
| 2021 | $4,690 | $57,700 | $9,060 | $48,640 |
| 2020 | $4,423 | $56,570 | $8,880 | $47,690 |
| 2019 | $4,413 | $56,570 | $8,880 | $47,690 |
| 2018 | $4,347 | $56,550 | $8,880 | $47,670 |
| 2017 | $4,510 | $57,120 | $8,970 | $48,150 |
| 2016 | $4,356 | $57,700 | $9,060 | $48,640 |
| 2015 | $4,172 | $56,570 | $8,880 | $47,690 |
| 2014 | $4,145 | $55,600 | $8,730 | $46,870 |
| 2013 | -- | $55,600 | $8,730 | $46,870 |
Source: Public Records
Map
Nearby Homes
- 4619 Carol Ct
- 2706 S Skyway Rd
- 2603 S Avion Dr
- 2330 S Airport Rd
- 2701 S Avion Dr
- 1015 Mcmullen Rd
- 112 Harrison St
- 4016 W Middle Rd
- 25 Santa Anita Dr
- 426 W Garfield Ave
- 104 Fairoaks Ct
- 320 Treasure St
- 3803 Chalmers Ave
- 0 Crestridge Dr Unit 1201261
- 5632 W Overland Pass
- 873 S Kim Moor Rd
- 2025 S Joyce St
- 6114 S Adams St
- 3916 Chalmers Ave
- 404 Bird Ave