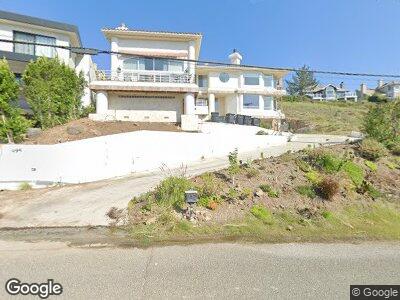
495 Lake Sherwood Dr Lake Sherwood, CA 91361
Estimated Value: $2,741,000 - $2,866,000
4
Beds
3
Baths
3,877
Sq Ft
$719/Sq Ft
Est. Value
About This Home
This home is located at 495 Lake Sherwood Dr, Lake Sherwood, CA 91361 and is currently estimated at $2,788,619, approximately $719 per square foot. 495 Lake Sherwood Dr is a home located in Ventura County with nearby schools including Westlake Elementary School, Colina Middle School, and Westlake High School.
Ownership History
Date
Name
Owned For
Owner Type
Purchase Details
Closed on
Oct 29, 2015
Sold by
Noell Rhonda R
Bought by
Noell Craig F
Current Estimated Value
Purchase Details
Closed on
Jul 6, 2006
Sold by
Noell Craig Forrest
Bought by
Noell Craig Forrest and Noell Rhonda R
Purchase Details
Closed on
Jun 28, 1999
Sold by
Howe Leslie D
Bought by
Noell Craig Forrest
Home Financials for this Owner
Home Financials are based on the most recent Mortgage that was taken out on this home.
Original Mortgage
$734,960
Interest Rate
6%
Purchase Details
Closed on
Jan 16, 1998
Sold by
Lsr Limited Partnership
Bought by
Howe Leslie D
Purchase Details
Closed on
Mar 31, 1994
Sold by
Nicholson John F
Bought by
Lsr Ltd Partnership
Purchase Details
Closed on
Jul 9, 1993
Sold by
Elenes Richard and Walters Sam
Bought by
Nicholson John F
Create a Home Valuation Report for This Property
The Home Valuation Report is an in-depth analysis detailing your home's value as well as a comparison with similar homes in the area
Home Values in the Area
Average Home Value in this Area
Purchase History
| Date | Buyer | Sale Price | Title Company |
|---|---|---|---|
| Noell Craig F | -- | None Available | |
| Noell Craig Forrest | -- | None Available | |
| Noell Craig Forrest | $919,000 | Equity Title | |
| Howe Leslie D | -- | Chicago Title Co | |
| Lsr Ltd Partnership | $675,000 | First American Title Ins Co | |
| Nicholson John F | -- | First American Title Ins Co |
Source: Public Records
Mortgage History
| Date | Status | Borrower | Loan Amount |
|---|---|---|---|
| Open | Noell Craig Forrest | $2,500,000 | |
| Closed | Noell Craig Forrest | $734,960 | |
| Previous Owner | Howe Leslie D | $650,000 |
Source: Public Records
Tax History Compared to Growth
Tax History
| Year | Tax Paid | Tax Assessment Tax Assessment Total Assessment is a certain percentage of the fair market value that is determined by local assessors to be the total taxable value of land and additions on the property. | Land | Improvement |
|---|---|---|---|---|
| 2024 | $15,946 | $1,384,320 | $828,758 | $555,562 |
| 2023 | $15,493 | $1,357,177 | $812,508 | $544,669 |
| 2022 | $15,089 | $1,330,566 | $796,576 | $533,990 |
| 2021 | $14,721 | $1,304,477 | $780,957 | $523,520 |
| 2020 | $14,420 | $1,291,102 | $772,950 | $518,152 |
| 2019 | $13,953 | $1,265,788 | $757,795 | $507,993 |
| 2018 | $13,629 | $1,240,970 | $742,937 | $498,033 |
| 2017 | $13,266 | $1,216,638 | $728,370 | $488,268 |
| 2016 | $13,171 | $1,192,784 | $714,089 | $478,695 |
| 2015 | $12,915 | $1,174,868 | $703,363 | $471,505 |
| 2014 | $12,707 | $1,151,856 | $689,586 | $462,270 |
Source: Public Records
Map
Nearby Homes
- 548 Cricketfield Ct
- 219 Baybrook Ct
- 852 Ravensbury St
- 844 Lake Sherwood Dr
- 196 Lake Sherwood Dr
- 1668 Abbotsbury St
- 1766 Stanhope Ct
- 1658 Bushgrove Ct
- 87 Lake Sherwood Dr
- 1677 Bushgrove Ct
- 2102 Trentham Rd
- 2385 Calbourne Ct
- 1511 Verde Ridge Ln
- 124 Lower Lake Rd
- 1653 Vista Oaks Way
- 500 Lower Lake Rd
- 2568 Queen's Garden Dr
- 2160 Marshbrook Rd