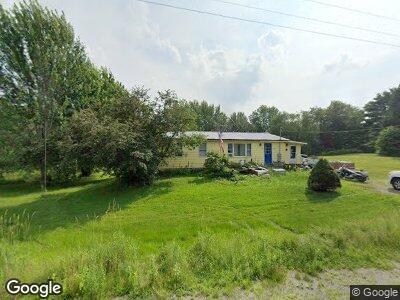
496 N Howland Rd Howland, ME 04448
Estimated Value: $36,000 - $233,000
--
Bed
--
Bath
--
Sq Ft
1
Acres
About This Home
This home is located at 496 N Howland Rd, Howland, ME 04448 and is currently estimated at $154,217. 496 N Howland Rd is a home with nearby schools including Enfield Station Elementary School, Hichborn Middle School, and Penobscot Valley High School.
Create a Home Valuation Report for This Property
The Home Valuation Report is an in-depth analysis detailing your home's value as well as a comparison with similar homes in the area
Home Values in the Area
Average Home Value in this Area
Mortgage History
| Date | Status | Borrower | Loan Amount |
|---|---|---|---|
| Closed | Clark Gary O | $70,000 |
Source: Public Records
Tax History Compared to Growth
Tax History
| Year | Tax Paid | Tax Assessment Tax Assessment Total Assessment is a certain percentage of the fair market value that is determined by local assessors to be the total taxable value of land and additions on the property. | Land | Improvement |
|---|---|---|---|---|
| 2024 | $1,743 | $82,980 | $23,810 | $59,170 |
| 2023 | $1,830 | $82,980 | $23,810 | $59,170 |
| 2022 | $1,470 | $60,010 | $17,250 | $42,760 |
| 2021 | $1,386 | $60,010 | $17,250 | $42,760 |
| 2020 | $1,158 | $60,010 | $17,250 | $42,760 |
| 2019 | $1,149 | $60,010 | $17,250 | $42,760 |
| 2018 | $1,149 | $60,010 | $17,250 | $42,760 |
| 2017 | $1,380 | $60,010 | $17,250 | $42,760 |
| 2016 | $1,320 | $60,010 | $17,250 | $42,760 |
| 2015 | $1,272 | $60,010 | $17,250 | $42,760 |
| 2014 | $1,110 | $60,010 | $17,250 | $42,760 |
| 2013 | $894 | $60,010 | $17,250 | $42,760 |
Source: Public Records
Map
Nearby Homes