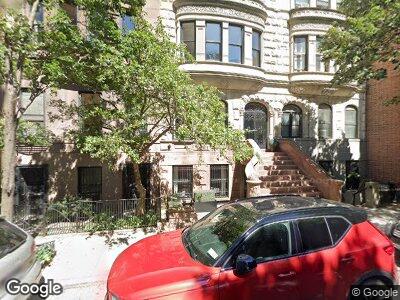
5 E 93rd St Unit Building New York, NY 10128
Carnegie Hill NeighborhoodEstimated Value: $6,852,000 - $11,494,922
--
Bed
7
Baths
6,254
Sq Ft
$1,467/Sq Ft
Est. Value
About This Home
This home is located at 5 E 93rd St Unit Building, New York, NY 10128 and is currently estimated at $9,173,461, approximately $1,466 per square foot. 5 E 93rd St Unit Building is a home located in New York County with nearby schools including Ps 198 Isador E Ida Straus, Robert F Wagner Middle School, and Clinton School.
Ownership History
Date
Name
Owned For
Owner Type
Purchase Details
Closed on
Jul 21, 2016
Sold by
Weinstein Jawitz Lynn M and Barry Weinstein %
Bought by
Frangenberg Gunter and Frangenberg Katerina
Current Estimated Value
Home Financials for this Owner
Home Financials are based on the most recent Mortgage that was taken out on this home.
Original Mortgage
$6,890,000
Outstanding Balance
$5,642,987
Interest Rate
3.56%
Mortgage Type
Purchase Money Mortgage
Estimated Equity
$2,559,077
Purchase Details
Closed on
Apr 2, 2002
Sold by
Weinstein Norman S and Jawitz Lynn M
Bought by
Jawitz Lynn M
Home Financials for this Owner
Home Financials are based on the most recent Mortgage that was taken out on this home.
Original Mortgage
$1,335,000
Interest Rate
7.15%
Purchase Details
Closed on
Aug 13, 1997
Sold by
Clark Louise F and Smith Margaret R
Bought by
Weinstein Norman J and Jawitz Lynn M
Create a Home Valuation Report for This Property
The Home Valuation Report is an in-depth analysis detailing your home's value as well as a comparison with similar homes in the area
Home Values in the Area
Average Home Value in this Area
Purchase History
| Date | Buyer | Sale Price | Title Company |
|---|---|---|---|
| Frangenberg Gunter | $10,600,000 | -- | |
| Jawitz Lynn M | -- | -- | |
| Weinstein Norman J | $3,950,000 | Commonwealth Land Title Ins |
Source: Public Records
Mortgage History
| Date | Status | Borrower | Loan Amount |
|---|---|---|---|
| Open | Frangenberg Gunter | $6,890,000 | |
| Previous Owner | Jawitz Lynn M | $500,000 | |
| Previous Owner | Jawitz Lynn M | $1,335,000 |
Source: Public Records
Tax History Compared to Growth
Tax History
| Year | Tax Paid | Tax Assessment Tax Assessment Total Assessment is a certain percentage of the fair market value that is determined by local assessors to be the total taxable value of land and additions on the property. | Land | Improvement |
|---|---|---|---|---|
| 2024 | $77,811 | $387,410 | $378,540 | $147,762 |
| 2023 | $74,226 | $365,483 | $216,490 | $148,993 |
| 2022 | $69,528 | $677,820 | $378,540 | $299,280 |
| 2021 | $72,896 | $728,340 | $378,540 | $349,800 |
| 2020 | $69,170 | $773,220 | $378,540 | $394,680 |
| 2019 | $67,535 | $793,320 | $378,540 | $414,780 |
| 2018 | $62,086 | $304,569 | $154,712 | $149,857 |
| 2017 | $58,865 | $290,235 | $103,381 | $186,854 |
| 2016 | $57,394 | $288,650 | $101,510 | $187,140 |
| 2015 | $32,804 | $272,319 | $143,207 | $129,112 |
| 2014 | $32,804 | $269,035 | $169,782 | $99,253 |
Source: Public Records
Map
Nearby Homes
- 16 E 94th St
- 15 E 93rd St
- 13 E 94th St
- 1125 5th Ave Unit 8THFLR
- 1125 5th Ave Unit 10FL
- 1120 5th Ave Unit 11B
- 1120 5th Ave Unit PHB
- 30 E 95th St Unit 3A
- 1133 5th Ave Unit 7A
- 4 E 95th St Unit 7A
- 4 E 95th St Unit 1B
- 4 E 95th St Unit 2A
- 40 E 94th St Unit 11A
- 40 E 94th St Unit 17A
- 40 E 94th St Unit 4G
- 1115 5th Ave Unit 15A
- 55 E 93rd St Unit 6C
- 19 E 92nd St
- 64 E 94th St Unit 1A
- 64 E 94th St Unit 2B