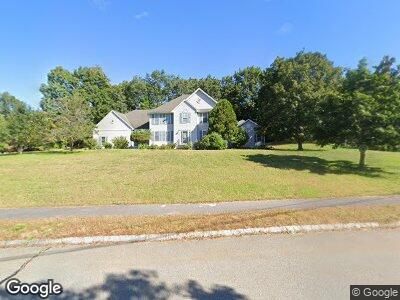
5 Hadley Dr Nashua, NH 03062
Southwest Nashua NeighborhoodEstimated Value: $878,154 - $991,000
5
Beds
4
Baths
3,432
Sq Ft
$275/Sq Ft
Est. Value
About This Home
This home is located at 5 Hadley Dr, Nashua, NH 03062 and is currently estimated at $943,539, approximately $274 per square foot. 5 Hadley Dr is a home located in Hillsborough County with nearby schools including Main Dunstable School, Elm Street Middle School, and Nashua High School South.
Ownership History
Date
Name
Owned For
Owner Type
Purchase Details
Closed on
Nov 15, 2017
Sold by
Allen Okoziem N
Bought by
Allen Oral M
Current Estimated Value
Purchase Details
Closed on
Mar 7, 1997
Sold by
Ashwood Dev Co Inc
Bought by
Naro James E and Naro Karen L
Home Financials for this Owner
Home Financials are based on the most recent Mortgage that was taken out on this home.
Original Mortgage
$195,900
Interest Rate
7.77%
Create a Home Valuation Report for This Property
The Home Valuation Report is an in-depth analysis detailing your home's value as well as a comparison with similar homes in the area
Home Values in the Area
Average Home Value in this Area
Purchase History
| Date | Buyer | Sale Price | Title Company |
|---|---|---|---|
| Allen Oral M | -- | -- | |
| Naro James E | $261,200 | -- |
Source: Public Records
Mortgage History
| Date | Status | Borrower | Loan Amount |
|---|---|---|---|
| Previous Owner | Naro James E | $147,845 | |
| Previous Owner | Naro James E | $195,900 |
Source: Public Records
Tax History Compared to Growth
Tax History
| Year | Tax Paid | Tax Assessment Tax Assessment Total Assessment is a certain percentage of the fair market value that is determined by local assessors to be the total taxable value of land and additions on the property. | Land | Improvement |
|---|---|---|---|---|
| 2023 | $12,488 | $685,000 | $117,000 | $568,000 |
| 2022 | $12,378 | $685,000 | $117,000 | $568,000 |
| 2021 | $13,147 | $566,200 | $163,900 | $402,300 |
| 2020 | $12,865 | $569,000 | $163,900 | $405,100 |
| 2019 | $12,381 | $569,000 | $163,900 | $405,100 |
| 2018 | $12,068 | $569,000 | $163,900 | $405,100 |
| 2017 | $11,693 | $453,400 | $119,500 | $333,900 |
| 2016 | $11,266 | $449,400 | $119,500 | $329,900 |
| 2015 | $9,790 | $399,100 | $119,500 | $279,600 |
| 2014 | $9,598 | $399,100 | $119,500 | $279,600 |
Source: Public Records
Map
Nearby Homes