5002 W Muirkirk Rd West Jordan, UT 84081
Copper Hills NeighborhoodEstimated Value: $449,000 - $479,000
3
Beds
1
Bath
1,480
Sq Ft
$314/Sq Ft
Est. Value
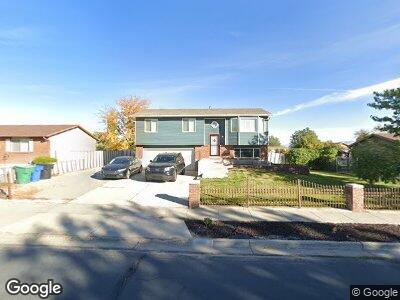
About This Home
This home is located at 5002 W Muirkirk Rd, West Jordan, UT 84081 and is currently estimated at $465,374, approximately $314 per square foot. 5002 W Muirkirk Rd is a home located in Salt Lake County with nearby schools including Jordan Hills Elementary School, West Hills Middle School, and Copper Hills High School.
Ownership History
Date
Name
Owned For
Owner Type
Purchase Details
Closed on
Mar 10, 2021
Sold by
Shipley Colton and Shipley Kaytlin
Bought by
Neilson Gary E and Neilson Natalie A
Current Estimated Value
Home Financials for this Owner
Home Financials are based on the most recent Mortgage that was taken out on this home.
Original Mortgage
$352,497
Outstanding Balance
$321,819
Interest Rate
2.73%
Mortgage Type
FHA
Estimated Equity
$143,914
Purchase Details
Closed on
Jan 12, 2017
Sold by
Young Guy Mark and Young Karoleena A
Bought by
Shipley Kaytlin
Home Financials for this Owner
Home Financials are based on the most recent Mortgage that was taken out on this home.
Original Mortgage
$7,980
Interest Rate
4.08%
Mortgage Type
FHA
Create a Home Valuation Report for This Property
The Home Valuation Report is an in-depth analysis detailing your home's value as well as a comparison with similar homes in the area
Home Values in the Area
Average Home Value in this Area
Purchase History
| Date | Buyer | Sale Price | Title Company |
|---|---|---|---|
| Neilson Gary E | -- | Integrated Title Ins Svcs | |
| Shipley Kaytlin | -- | Integrated Title Ins Svcs |
Source: Public Records
Mortgage History
| Date | Status | Borrower | Loan Amount |
|---|---|---|---|
| Open | Neilson Gary Elliott | $61,067 | |
| Closed | Neilson Gary E | $54,000 | |
| Open | Neilson Gary E | $352,497 | |
| Previous Owner | Shipley Colton | $255,392 | |
| Previous Owner | Shipley Colton | $47,380 | |
| Previous Owner | Shipley Colton | $225,340 | |
| Previous Owner | Shipley Kaytlin | $7,980 | |
| Previous Owner | Shipley Kaytlin | $223,870 | |
| Previous Owner | Young Guy Mark | $75,000 | |
| Previous Owner | Young Guy Mark | $118,200 |
Source: Public Records
Tax History Compared to Growth
Tax History
| Year | Tax Paid | Tax Assessment Tax Assessment Total Assessment is a certain percentage of the fair market value that is determined by local assessors to be the total taxable value of land and additions on the property. | Land | Improvement |
|---|---|---|---|---|
| 2023 | $2,262 | $410,200 | $132,600 | $277,600 |
| 2022 | $2,352 | $419,500 | $130,000 | $289,500 |
| 2021 | $1,964 | $318,900 | $105,000 | $213,900 |
| 2020 | $1,827 | $278,500 | $89,000 | $189,500 |
| 2019 | $1,807 | $270,100 | $89,000 | $181,100 |
| 2018 | $1,696 | $251,400 | $86,000 | $165,400 |
| 2017 | $17 | $205,400 | $86,000 | $119,400 |
| 2016 | $17 | $195,400 | $86,000 | $109,400 |
| 2015 | $1,398 | $189,000 | $87,600 | $101,400 |
| 2014 | $155 | $187,100 | $87,600 | $99,500 |
Source: Public Records
Map
Nearby Homes
- 5066 W 8620 S
- 8729 Mcginnis Ln
- 8808 S 4870 W
- 8366 S Cobble Cir
- 4831 W 8780 S
- 4706 Lone View Ct
- 4949 W Copper Canyon Way Unit 215
- 5425 Wheatridge Ln
- 4546 Copper Pot Ln
- 8489 Silo Dr
- 8782 S Placerville Cove
- 8377 S Wild Oak Dr
- 5091 W 7980 S
- 5556 W Geronimo Way
- 7937 S Cold Stone Ln
- 8851 Humboldt Ct
- 5209 Dove Creek Ln
- 5436 W 9120 S
- 4514 Ripple Dr
- 9414 S Wild Clover Ln