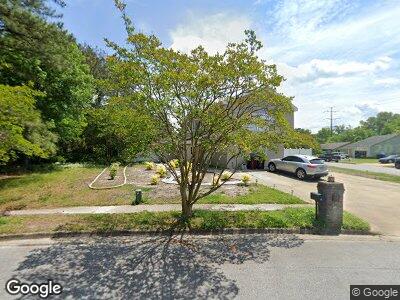
501 Thornloe Ln Chesapeake, VA 23320
Greenbrier East NeighborhoodEstimated Value: $534,000 - $616,678
6
Beds
5
Baths
4,500
Sq Ft
$127/Sq Ft
Est. Value
About This Home
This home is located at 501 Thornloe Ln, Chesapeake, VA 23320 and is currently estimated at $570,420, approximately $126 per square foot. 501 Thornloe Ln is a home located in Chesapeake City with nearby schools including Greenbrier Primary School, Greenbrier Intermediate School, and Greenbrier Middle.
Ownership History
Date
Name
Owned For
Owner Type
Purchase Details
Closed on
Jul 13, 2022
Sold by
Massey Veronnica R and Massey Zelmone
Bought by
Gooden Lashawn M and Bell Ieshewayne
Current Estimated Value
Home Financials for this Owner
Home Financials are based on the most recent Mortgage that was taken out on this home.
Original Mortgage
$465,465
Outstanding Balance
$446,490
Interest Rate
5.23%
Mortgage Type
VA
Estimated Equity
$123,930
Purchase Details
Closed on
Mar 28, 2011
Sold by
Gray Linda A
Bought by
Massey Zelmone
Home Financials for this Owner
Home Financials are based on the most recent Mortgage that was taken out on this home.
Original Mortgage
$296,235
Interest Rate
4.76%
Mortgage Type
VA
Purchase Details
Closed on
Aug 12, 1999
Sold by
Stone William M
Bought by
Gray Linda A
Home Financials for this Owner
Home Financials are based on the most recent Mortgage that was taken out on this home.
Original Mortgage
$138,344
Interest Rate
7.65%
Create a Home Valuation Report for This Property
The Home Valuation Report is an in-depth analysis detailing your home's value as well as a comparison with similar homes in the area
Home Values in the Area
Average Home Value in this Area
Purchase History
| Date | Buyer | Sale Price | Title Company |
|---|---|---|---|
| Gooden Lashawn M | $455,000 | Dickerson David D | |
| Massey Zelmone | $290,000 | -- | |
| Gray Linda A | $139,800 | -- |
Source: Public Records
Mortgage History
| Date | Status | Borrower | Loan Amount |
|---|---|---|---|
| Open | Gooden Lashawn M | $465,465 | |
| Previous Owner | Massey Veronica R | $305,520 | |
| Previous Owner | Massey Zelmone | $296,235 | |
| Previous Owner | Gray Linda A | $138,344 |
Source: Public Records
Tax History Compared to Growth
Tax History
| Year | Tax Paid | Tax Assessment Tax Assessment Total Assessment is a certain percentage of the fair market value that is determined by local assessors to be the total taxable value of land and additions on the property. | Land | Improvement |
|---|---|---|---|---|
| 2024 | $4,991 | $494,200 | $160,000 | $334,200 |
| 2023 | $4,606 | $456,000 | $145,000 | $311,000 |
| 2022 | $3,813 | $377,500 | $130,000 | $247,500 |
| 2021 | $3,589 | $341,800 | $110,000 | $231,800 |
| 2020 | $3,296 | $313,900 | $105,000 | $208,900 |
| 2019 | $3,296 | $313,900 | $105,000 | $208,900 |
| 2018 | $3,310 | $293,000 | $90,000 | $203,000 |
| 2017 | $3,120 | $297,100 | $90,000 | $207,100 |
| 2016 | $3,077 | $293,000 | $90,000 | $203,000 |
| 2015 | $3,077 | $293,000 | $90,000 | $203,000 |
| 2014 | $2,858 | $272,200 | $90,000 | $182,200 |
Source: Public Records
Map
Nearby Homes
- 813 Arondale Crescent
- 504 Brandon Way
- 15+ Clearfield Ave
- 524 Trolley Crossing
- 531 Trolley Crossing
- 920 Stanhope Gardens
- 521 Trolley Crossing
- 413 Brandon Way
- 424 Autumn Green Ln
- 428 Covington Ct
- 735 Great Marsh Ave
- 1052 Butte Ln
- 1054 Butte Ln
- 1056 Butte Ln
- 1063 Butte Ln
- 1062 Butte Ln
- 1064 Butte Ln
- 1066 Butte Ln
- 140 Springer Ln Unit 234
- 1109 Winsford Ln