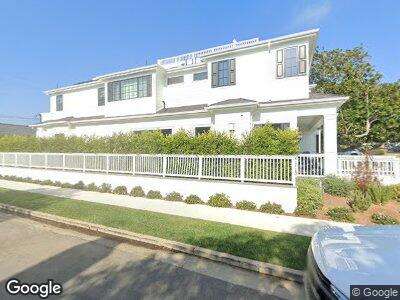
501 Via de la Paz Pacific Palisades, CA 90272
Pacific Palisades NeighborhoodEstimated Value: $7,552,000 - $9,234,000
5
Beds
7
Baths
7,600
Sq Ft
$1,118/Sq Ft
Est. Value
About This Home
This home is located at 501 Via de la Paz, Pacific Palisades, CA 90272 and is currently estimated at $8,499,822, approximately $1,118 per square foot. 501 Via de la Paz is a home located in Los Angeles County with nearby schools including Palisades Charter Elementary, Marquez Charter School, and Paul Revere Charter Middle School.
Ownership History
Date
Name
Owned For
Owner Type
Purchase Details
Closed on
Aug 14, 2023
Sold by
Lantana Development Company Inc and Lantana Development Company Inc
Bought by
Fisher Alex and Fisher Lindsey
Current Estimated Value
Home Financials for this Owner
Home Financials are based on the most recent Mortgage that was taken out on this home.
Interest Rate
6.96%
Purchase Details
Closed on
Aug 27, 2020
Sold by
Achen Michelle L and Estate Of Evelyn Z Smith
Bought by
Lantana Development Company Inc
Purchase Details
Closed on
Sep 16, 2005
Sold by
Smith Evelyn Z and Elsie V Zahig Testamentary Tru
Bought by
Smith Evelyn Z
Purchase Details
Closed on
May 18, 2005
Sold by
Smith Evelyn Z and Elsie V Zahig Testamentary Tru
Bought by
Smith Evelyn Z
Create a Home Valuation Report for This Property
The Home Valuation Report is an in-depth analysis detailing your home's value as well as a comparison with similar homes in the area
Home Values in the Area
Average Home Value in this Area
Purchase History
| Date | Buyer | Sale Price | Title Company |
|---|---|---|---|
| Fisher Alex | $9,550,000 | Old Republic Title Company | |
| Lantana Development Company Inc | $3,210,000 | Chicago Title Company | |
| Smith Evelyn Z | -- | -- |
Source: Public Records
Mortgage History
| Date | Status | Borrower | Loan Amount |
|---|---|---|---|
| Closed | Fisher Alex | -- | |
| Previous Owner | Lantera Development Company Inc | $4,000,000 | |
| Previous Owner | Smith Evelyn Z | $3,723,277 | |
| Previous Owner | Smith Evelyn Z | $938,250 | |
| Closed | Fisher Alex | $0 |
Source: Public Records
Tax History Compared to Growth
Tax History
| Year | Tax Paid | Tax Assessment Tax Assessment Total Assessment is a certain percentage of the fair market value that is determined by local assessors to be the total taxable value of land and additions on the property. | Land | Improvement |
|---|---|---|---|---|
| 2024 | $114,845 | $9,550,000 | $7,640,000 | $1,910,000 |
| 2023 | $40,334 | $3,339,683 | $2,671,747 | $667,936 |
| 2022 | $38,438 | $3,274,200 | $2,619,360 | $654,840 |
| 2021 | $37,986 | $3,210,000 | $2,568,000 | $642,000 |
| 2020 | $1,816 | $136,696 | $91,434 | $45,262 |
| 2019 | $1,751 | $134,017 | $89,642 | $44,375 |
| 2018 | $1,681 | $131,390 | $87,885 | $43,505 |
| 2016 | $1,591 | $126,289 | $84,473 | $41,816 |
| 2015 | $1,569 | $124,393 | $83,205 | $41,188 |
| 2014 | $1,585 | $121,958 | $81,576 | $40,382 |
Source: Public Records
Map
Nearby Homes
- 430 Via de la Paz
- 425 Swarthmore Ave
- 545 Swarthmore Ave
- 325 Via de la Paz
- 582 Radcliffe Ave
- 15449 De Pauw St
- 607 Via de la Paz
- 543 Radcliffe Ave
- 333 Lombard Ave
- 613 Swarthmore Ave
- 320 Mount Holyoke Ave
- 15515 Via de Las Olas
- 15519 Via de Las Olas
- 424 Lombard Ave
- 638 Swarthmore Ave
- 15257 De Pauw St
- 677 N Swarthmore Ave
- 15229 De Pauw St
- 15225 De Pauw St
- 15861 Seabec Cir