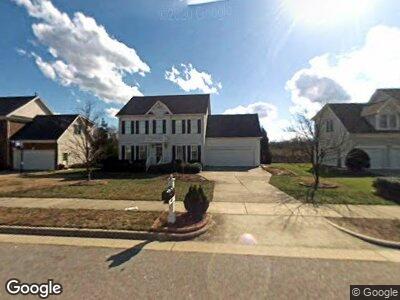
502 Canon Gate Dr Cary, NC 27518
Middle Creek NeighborhoodEstimated Value: $698,982 - $751,000
4
Beds
3
Baths
2,406
Sq Ft
$301/Sq Ft
Est. Value
About This Home
This home is located at 502 Canon Gate Dr, Cary, NC 27518 and is currently estimated at $725,246, approximately $301 per square foot. 502 Canon Gate Dr is a home located in Wake County with nearby schools including Penny Road Elementary School, Dillard Drive Magnet Middle School, and Resurrection Lutheran School.
Ownership History
Date
Name
Owned For
Owner Type
Purchase Details
Closed on
Sep 12, 2002
Sold by
Pannill David L and Mauldin Patricia C
Bought by
Pannill David L and Pannill Patricia C Mauldin
Current Estimated Value
Home Financials for this Owner
Home Financials are based on the most recent Mortgage that was taken out on this home.
Original Mortgage
$177,000
Interest Rate
5.98%
Purchase Details
Closed on
Nov 1, 2000
Sold by
Enright Michael J
Bought by
Pannill David L and Mauldin Patricia C
Home Financials for this Owner
Home Financials are based on the most recent Mortgage that was taken out on this home.
Original Mortgage
$158,000
Interest Rate
7.83%
Purchase Details
Closed on
Jan 12, 2000
Sold by
Robuck Homes Inc
Bought by
Enright Michael J and Enright Jill A
Home Financials for this Owner
Home Financials are based on the most recent Mortgage that was taken out on this home.
Original Mortgage
$182,500
Interest Rate
6.75%
Create a Home Valuation Report for This Property
The Home Valuation Report is an in-depth analysis detailing your home's value as well as a comparison with similar homes in the area
Home Values in the Area
Average Home Value in this Area
Purchase History
| Date | Buyer | Sale Price | Title Company |
|---|---|---|---|
| Pannill David L | -- | -- | |
| Pannill David L | $243,000 | -- | |
| Enright Michael J | $235,000 | -- |
Source: Public Records
Mortgage History
| Date | Status | Borrower | Loan Amount |
|---|---|---|---|
| Open | Pannill David L | $144,168 | |
| Closed | Pannill David L | $25,000 | |
| Closed | Pannill David L | $160,900 | |
| Closed | Pannill David L | $177,000 | |
| Closed | Pannill David Lee | $156,600 | |
| Closed | Pannill David L | $158,000 | |
| Previous Owner | Enright Michael J | $182,500 | |
| Closed | Pannill David L | $20,000 |
Source: Public Records
Tax History Compared to Growth
Tax History
| Year | Tax Paid | Tax Assessment Tax Assessment Total Assessment is a certain percentage of the fair market value that is determined by local assessors to be the total taxable value of land and additions on the property. | Land | Improvement |
|---|---|---|---|---|
| 2024 | $5,566 | $661,365 | $220,000 | $441,365 |
| 2023 | $3,979 | $395,091 | $80,000 | $315,091 |
| 2022 | $3,831 | $395,091 | $80,000 | $315,091 |
| 2021 | $3,754 | $395,091 | $80,000 | $315,091 |
| 2020 | $3,773 | $395,091 | $80,000 | $315,091 |
| 2019 | $3,770 | $350,268 | $100,000 | $250,268 |
| 2018 | $3,538 | $350,268 | $100,000 | $250,268 |
| 2017 | $3,400 | $350,268 | $100,000 | $250,268 |
| 2016 | $3,349 | $350,268 | $100,000 | $250,268 |
| 2015 | $3,504 | $353,851 | $104,000 | $249,851 |
| 2014 | -- | $353,851 | $104,000 | $249,851 |
Source: Public Records
Map
Nearby Homes
- 101 Silk Leaf Ct
- 103 Temple Gate Dr
- 3409 Lily Orchard Way
- 2629 Sweetgum Dr
- 137 Fawnwood Acres Dr
- 204 Oxford Mill Ct
- 105 Royal Glen Dr
- 201 Langston Mill Ct
- 110 Chapelwood Way
- 7557 Percussion Dr
- 7561 Percussion Dr
- 7545 Percussion Dr
- 7549 Percussion Dr
- 7584 Percussion Dr
- 7572 Percussion Dr
- 7540 Percussion Dr
- 7560 Percussion Dr
- 7556 Percussion Dr
- 102 Travilah Oaks Ln
- 229 Shillings Chase Dr